Monitoring the shifts, patterns, and trends in the used car market for the week ending 31st May offers valuable insights for businesses associated with the automotive sector. The data from the UK used car market, including both conventional Internal Combustion Engine vehicles (ICE) and Electric Vehicles (EV), provides useful pointers for car dealers, insurance companies, investment companies, car auction businesses, and car finance lenders and brokers. In this report, we dissect the data from the week ending 31st May 2025 and offer an analysis of the UK used car market trends to help your strategic planning.
Analysis: Used Car Market (ICE)
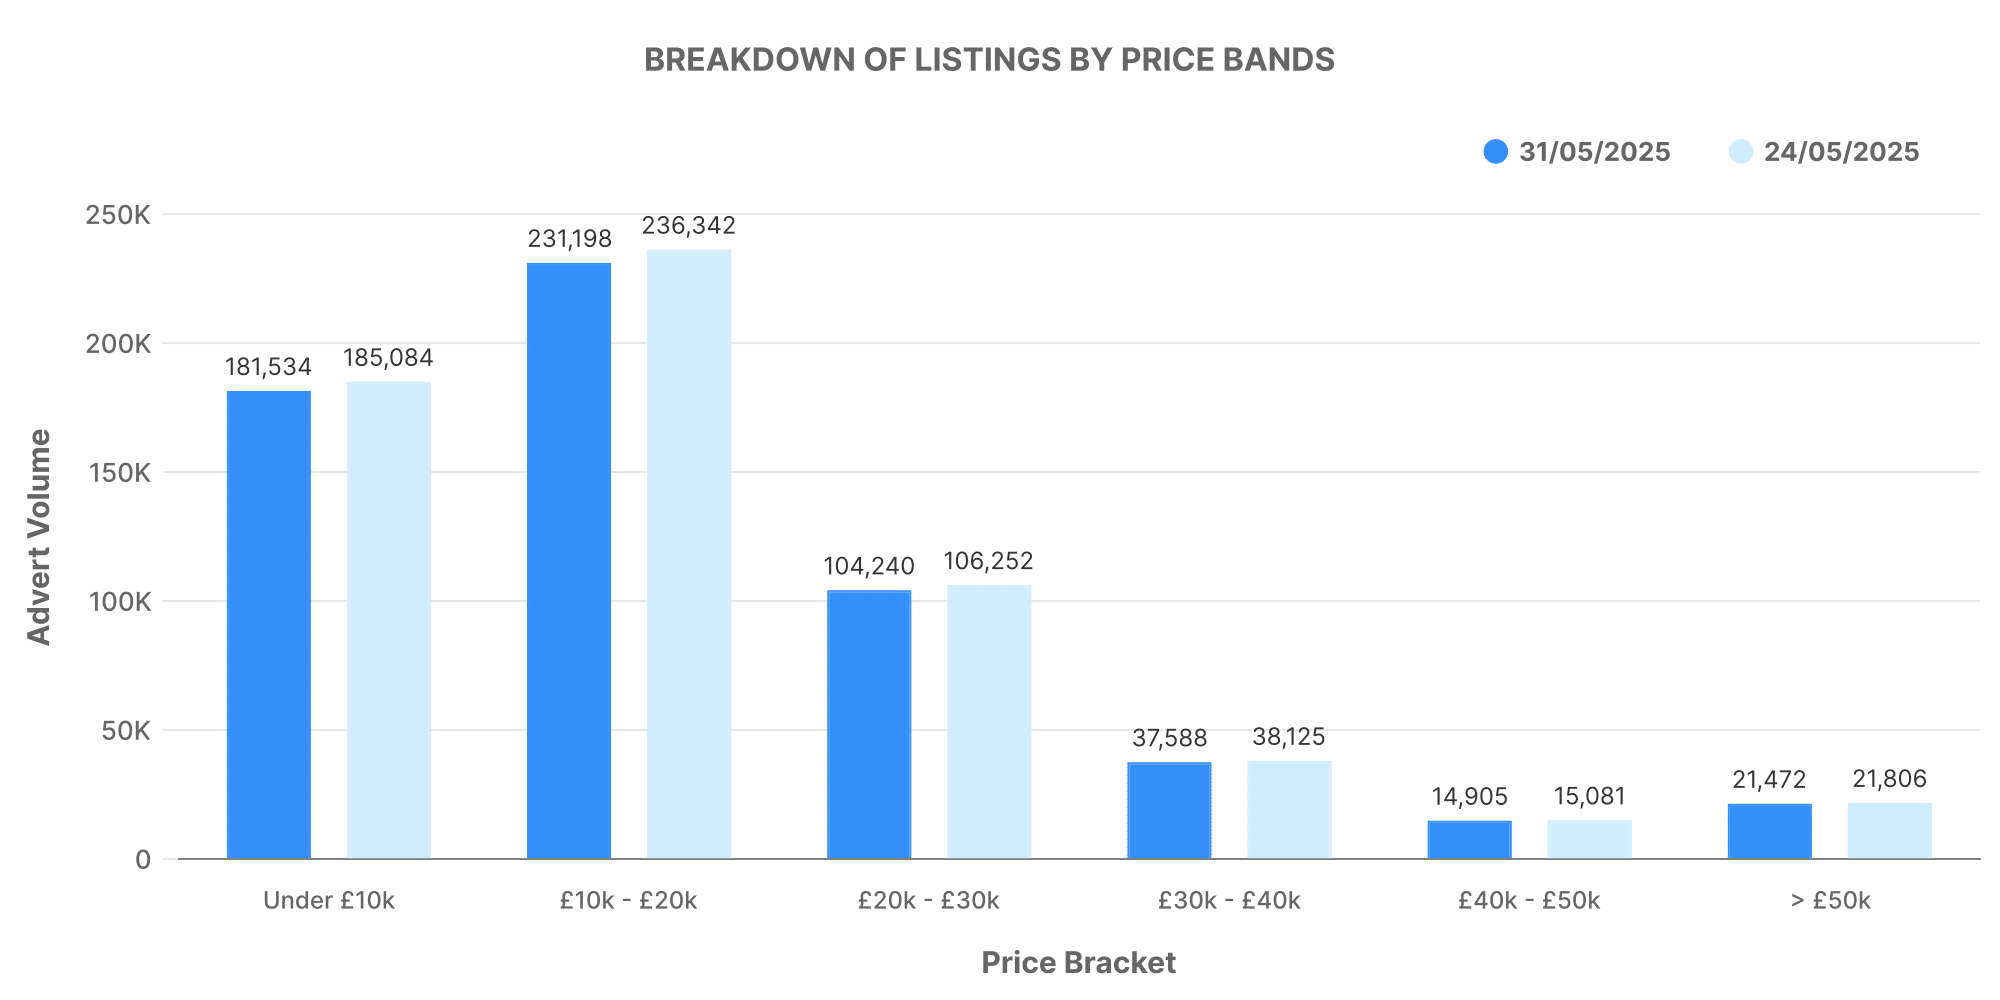
During the week in review, there were 605,008 ICE cars listed by 10,698 dealers. The average price for these vehicles was £18,680. Analysing by price bands, a clear trend is visible as the highest concentration of vehicles fell within the £10,000 to £20,000 range.
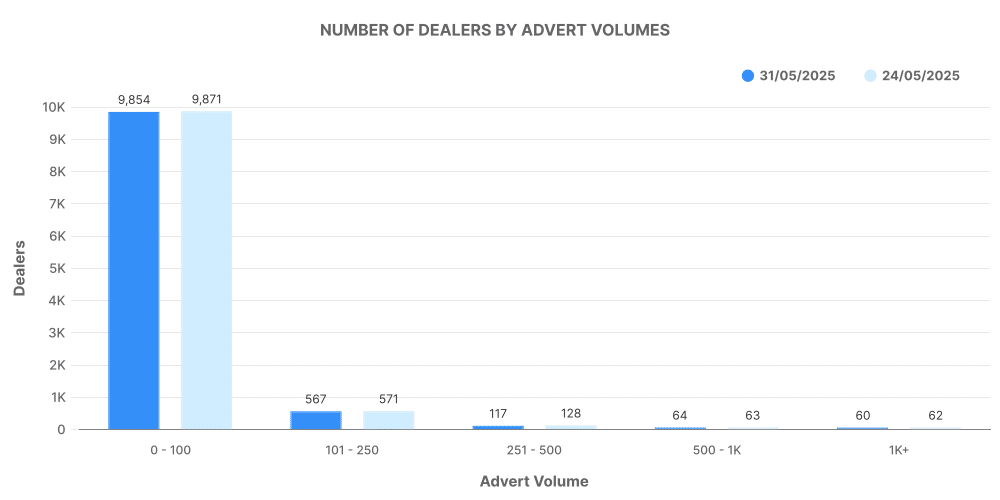
Upon an in-depth look into the dealer volume, it is evident that the market participation was diverse, with active participation from dealers of varying sizes. This reveals insights into the well-established nature of the ICE vehicles market.
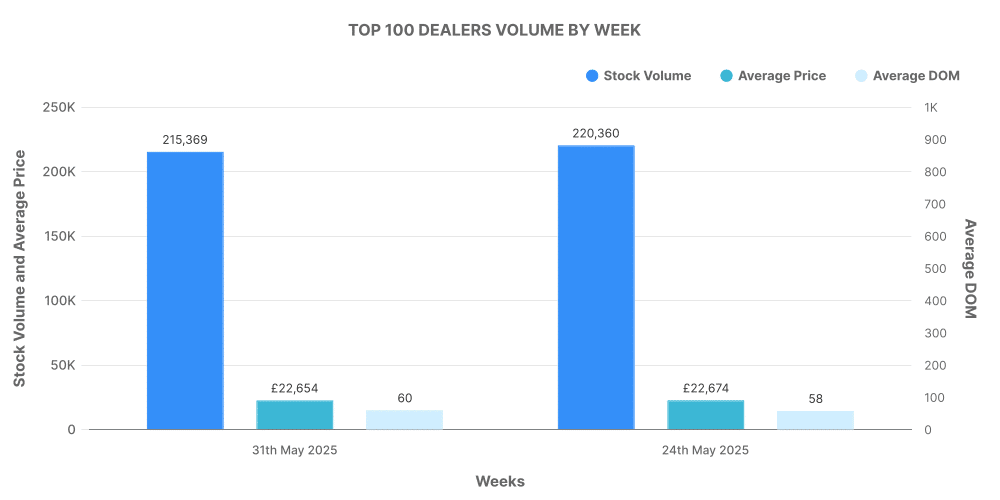
Our analysis of the top 100 dealers in ICE vehicles shows that they accounted for roughly 36% of total listings, offering vehicles at a slightly higher price than the market average.
Analysis: Electric Used Car Market (EV)
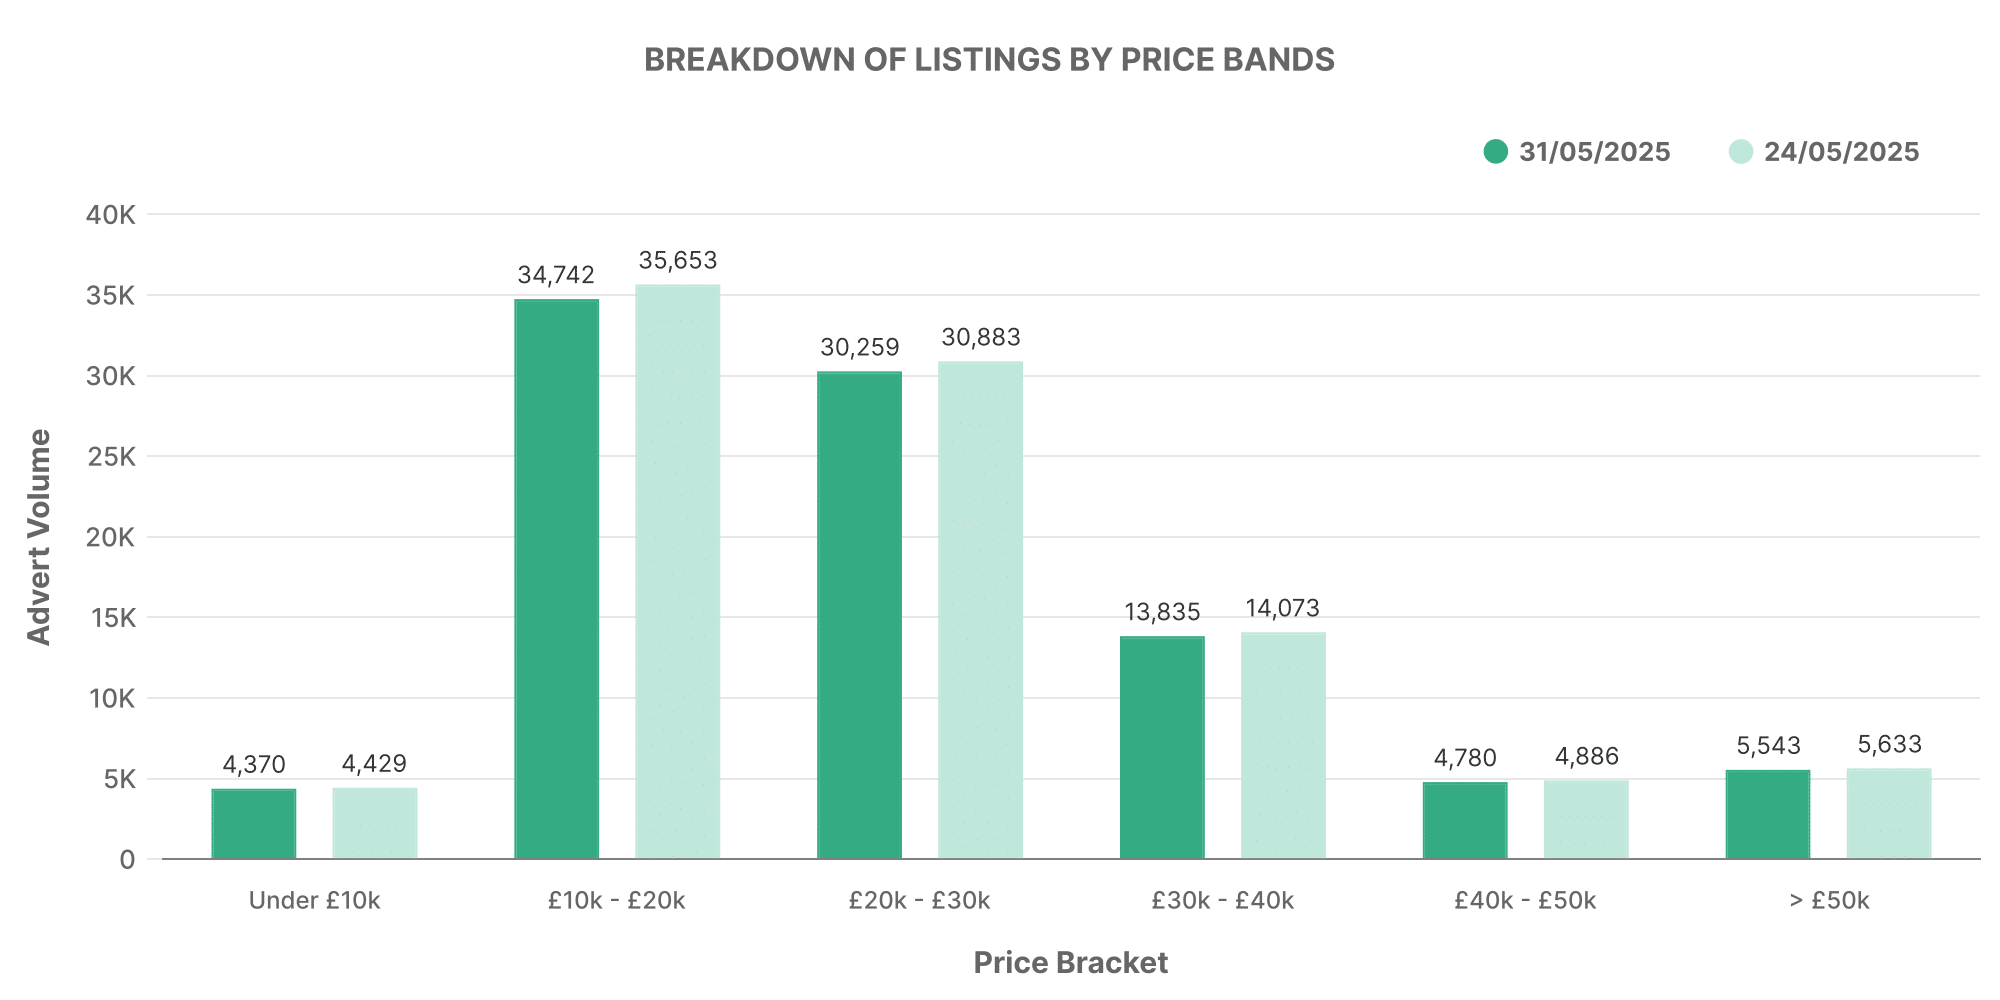
With respect to the electric used car (EV) market, there were 94,928 EVs listed by 4,712 dealers. The EV listings were concentrated heavily in the £10,000 to £20,000 range, similar to the ICE market. The average price, however, was higher for EVs (£26,369) compared to ICE vehicles.
The distribution of dealer volumes for EVs was skewed towards the lower end, signalling a relatively emerging market than the ICE vehicle segment.
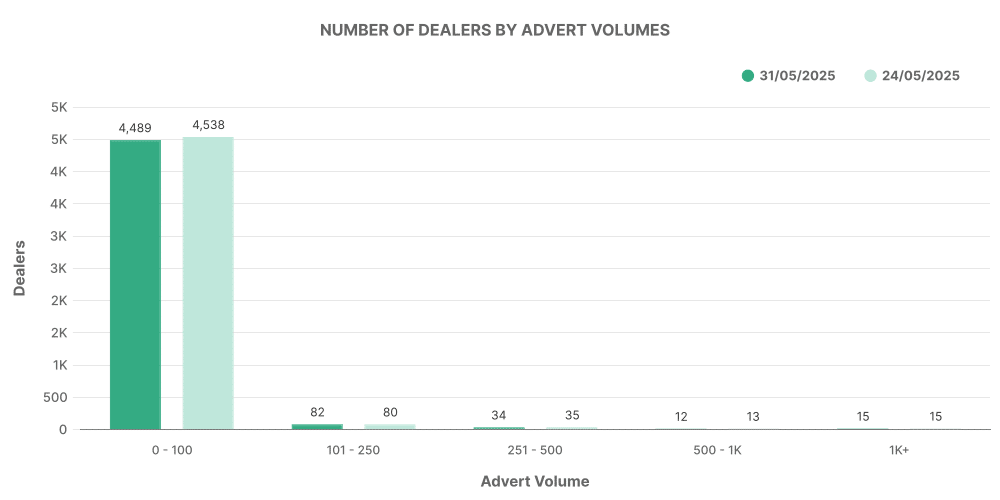
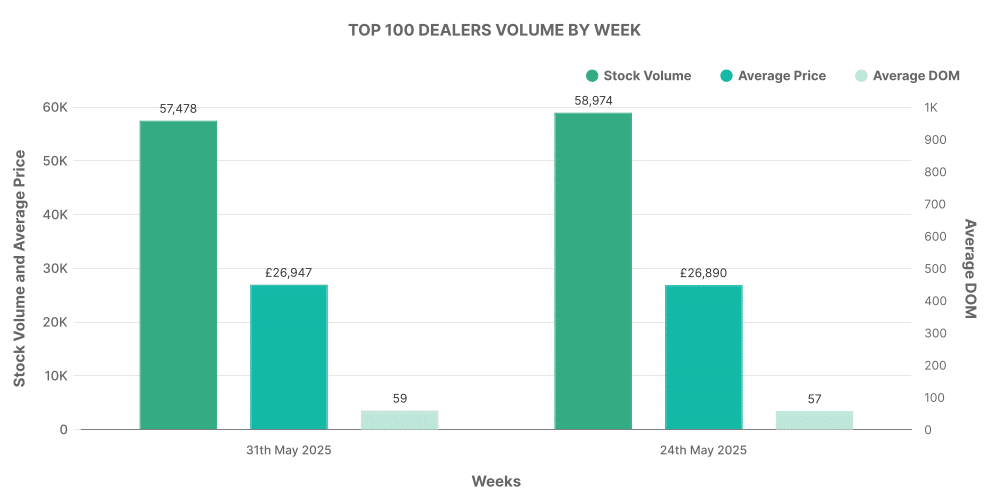
Interestingly, the top 100 EV dealers accounted for around 60% of the total EV listings with their average price somewhat higher than the market average.
Comparison: ICE vs EV
For the week ending 31st May, the data showed that the share of EVs was 15.69% as compared to 84.31% for ICE vehicles. The rise of the electric car segment is evident and likely to continue its uptrend, which can be seen as a shift in buying patterns resulting from evolving technology and sustainability concerns. While the participation of dealers in the EV market is currently low compared to the ICE market, the average price of EVs is higher, prompting a closer look at this segment for growth opportunities and strategic planning. As the EV market grows, components like UK car price trends and automotive market insights will be more relevant than ever.
