UK Weekly Used Car Market Data – 2nd to 9th August, 2025
Keeping up with the fluctuations and commonalities in the used car market is an absolute necessity for every stakeholder in the automotive industry. This examination unpacks comprehensive data of the used car market in the UK, weighing the performance of internal-combustion engine vehicles (ICE) against the rising electric used car market (EV).
Observing the ICE Market
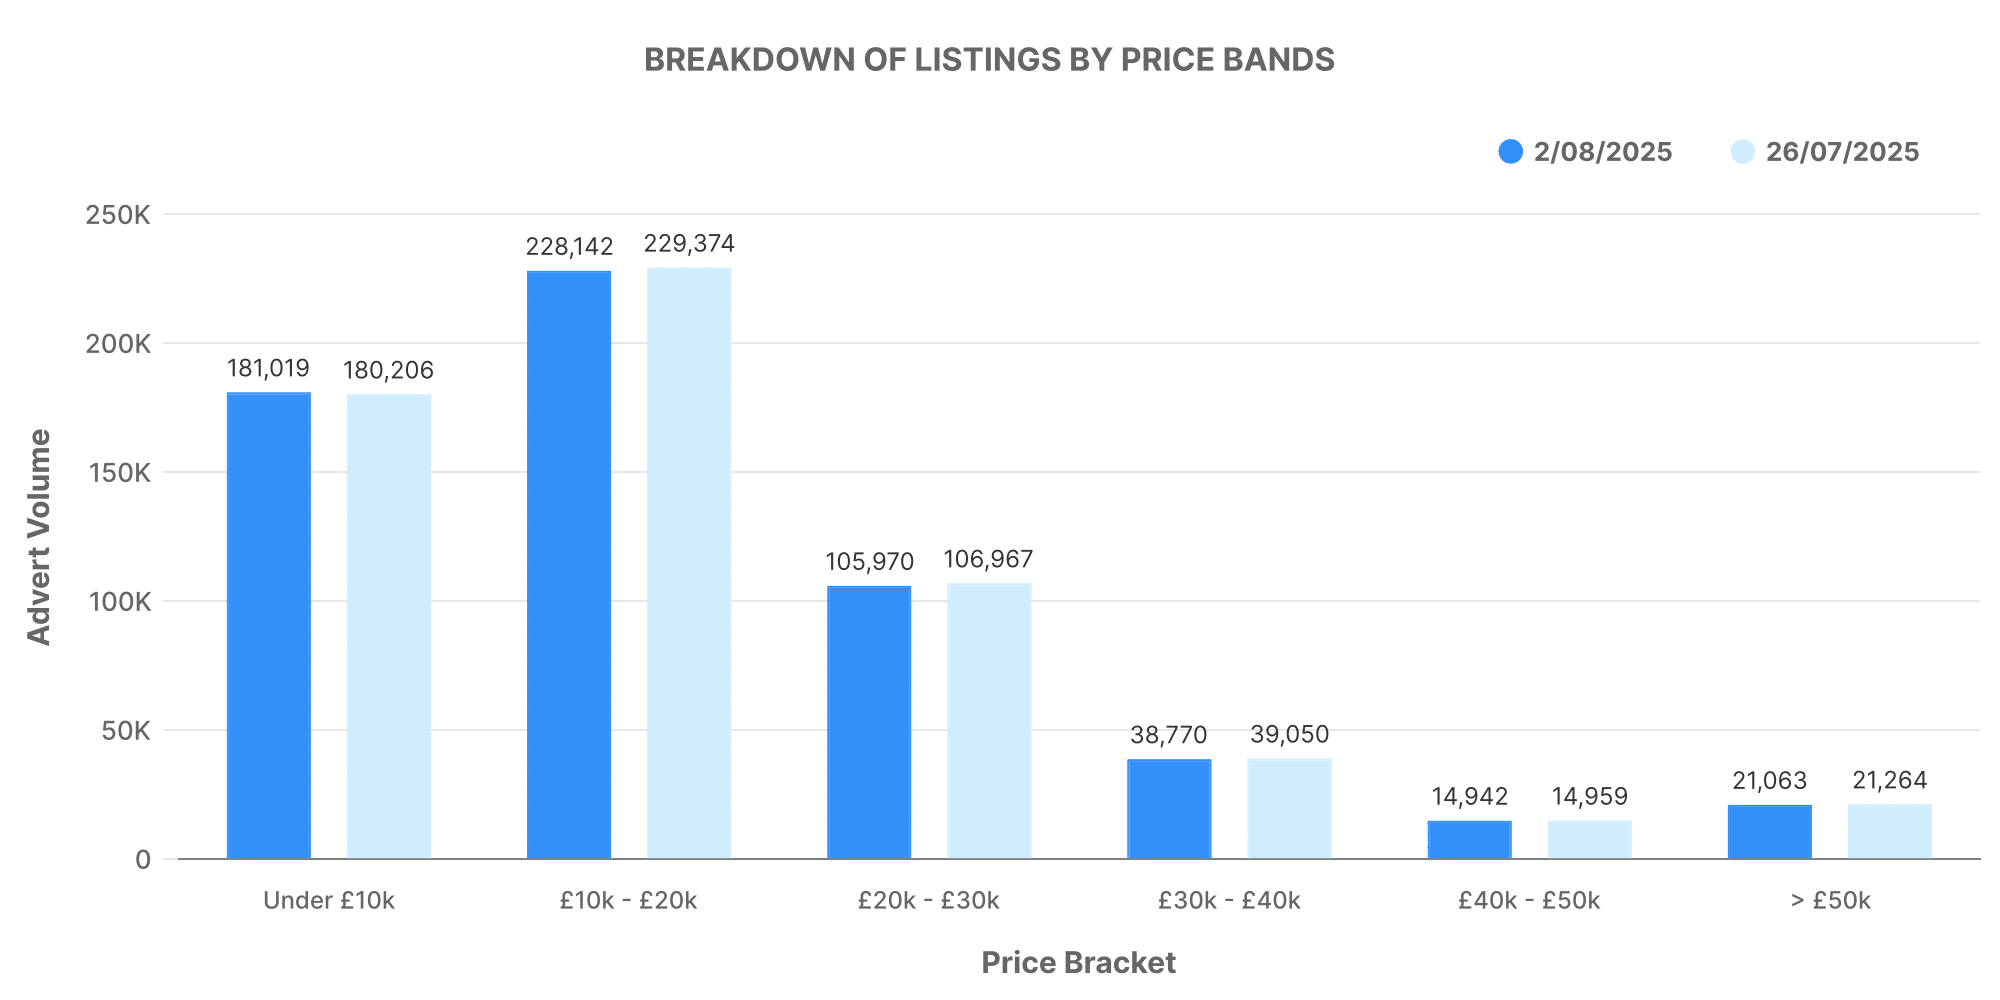
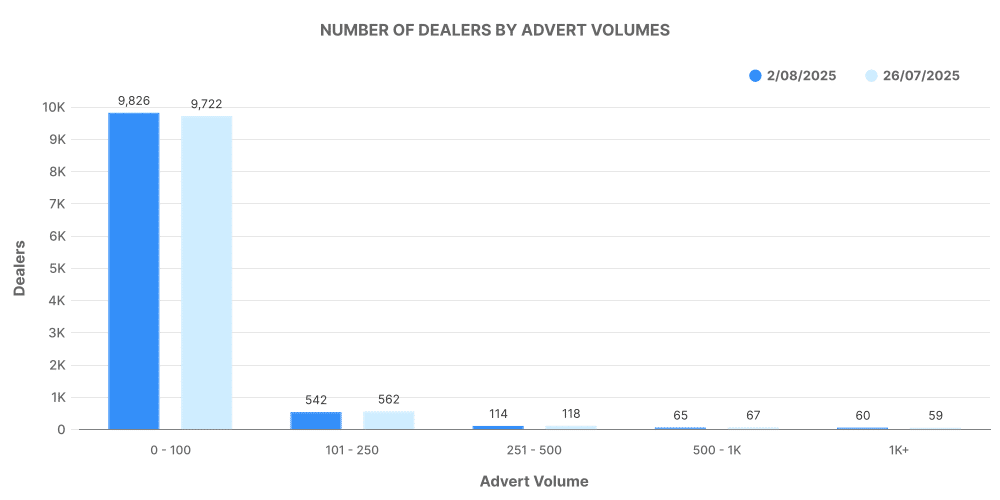
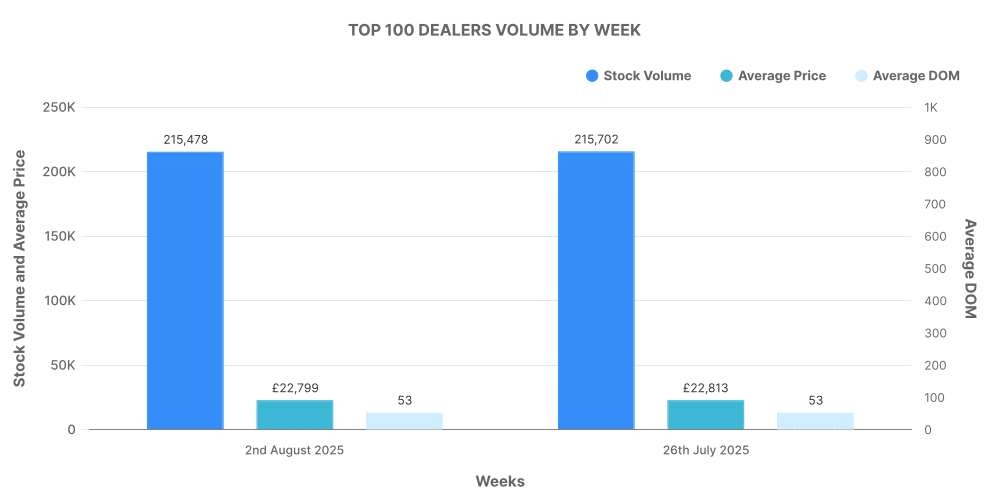
For the week running from July 26th through August 2nd, there were 10,640 active dealers operating from 14,616 rooftops, translating to 600,559 active listings. The average duration on the market was 82 days, with an average price of £18,670. Most cars, delineated by price bands, fell within the £0- 10,000 and £10, 000 – £20,000 ranges; 181,019 and 228,142 respectively. Dealers listed primarily between 0-100 cars with larger amounts of inventory being more uncommon. The market’s top 100 dealers listed 215,478 vehicles, with an average duration on the market of 53 days and average price slightly higher than that of the ICE market average.
Highlighting the EV Market
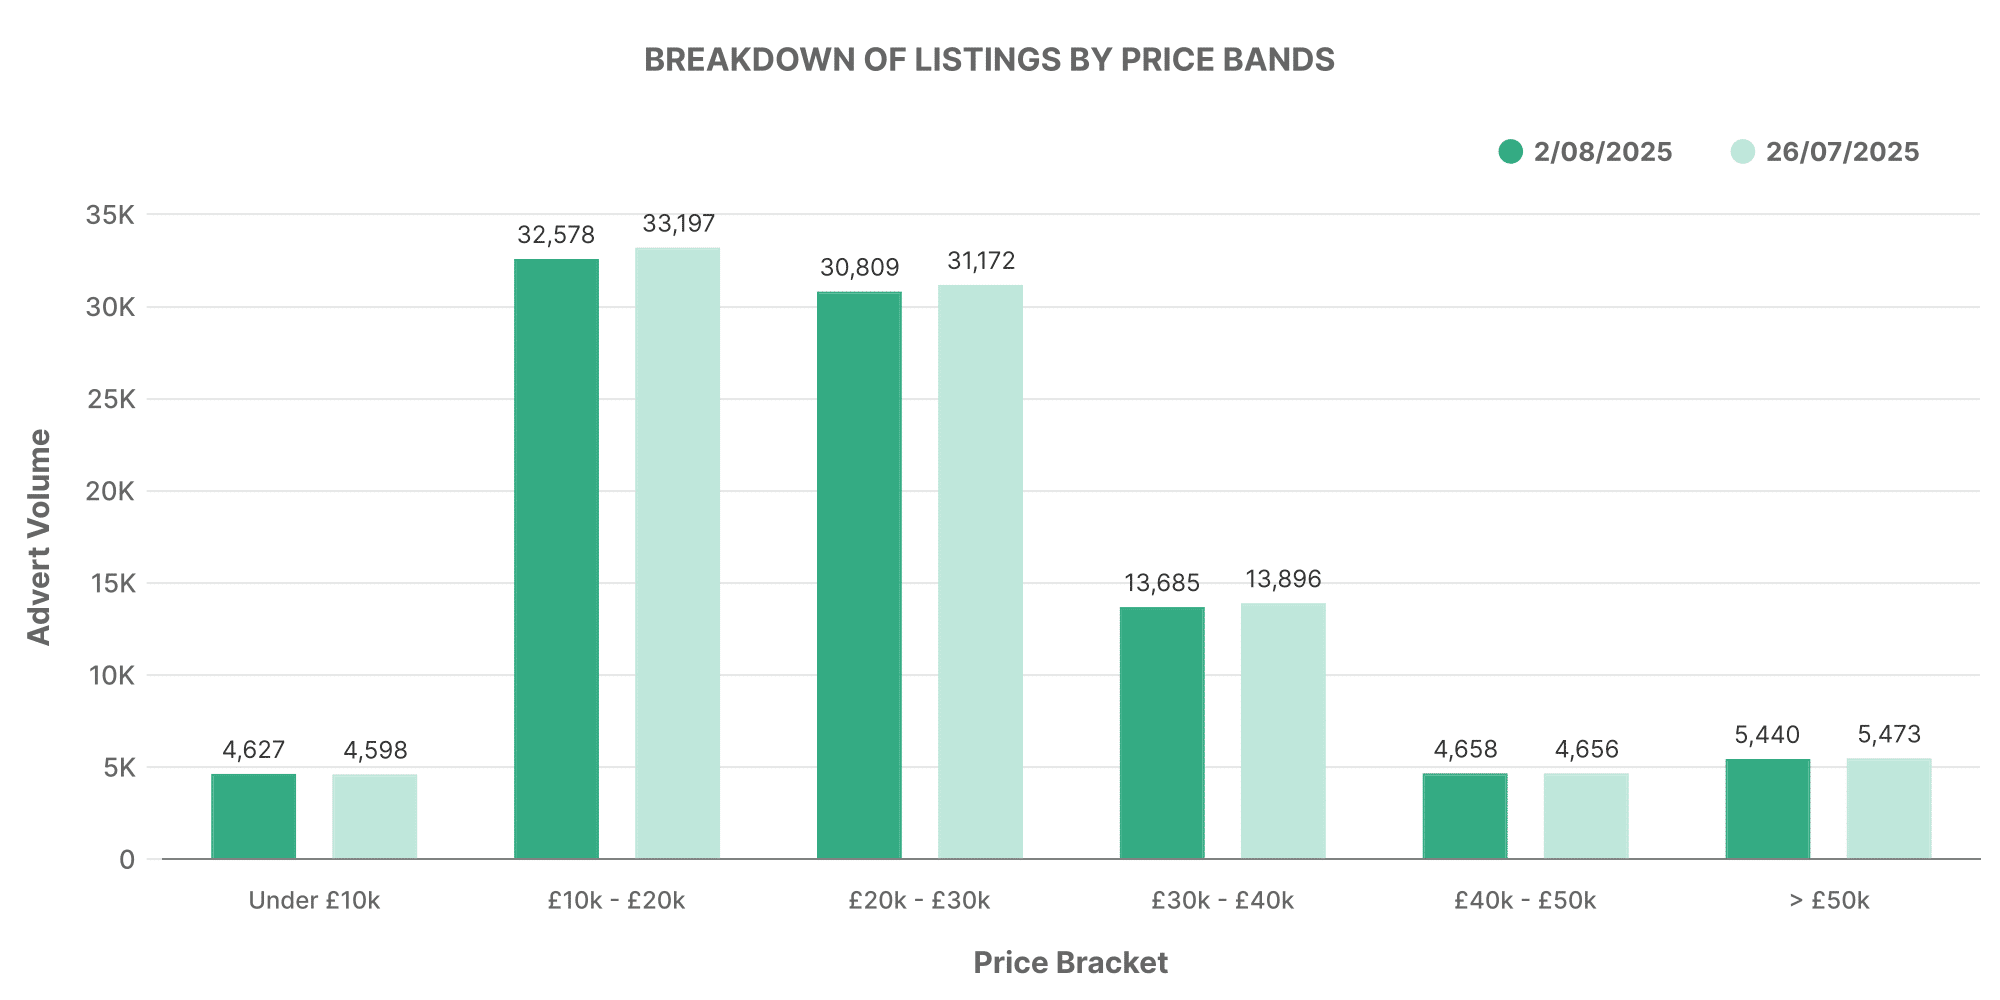
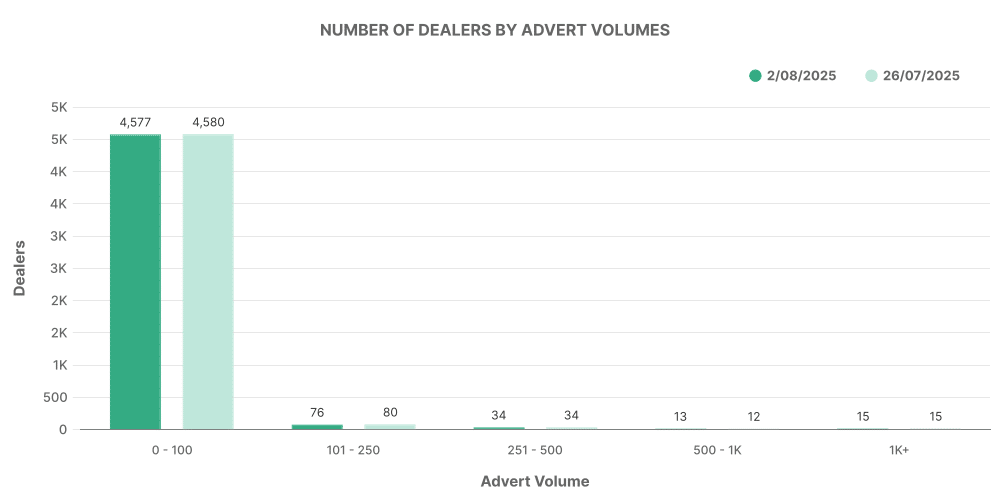
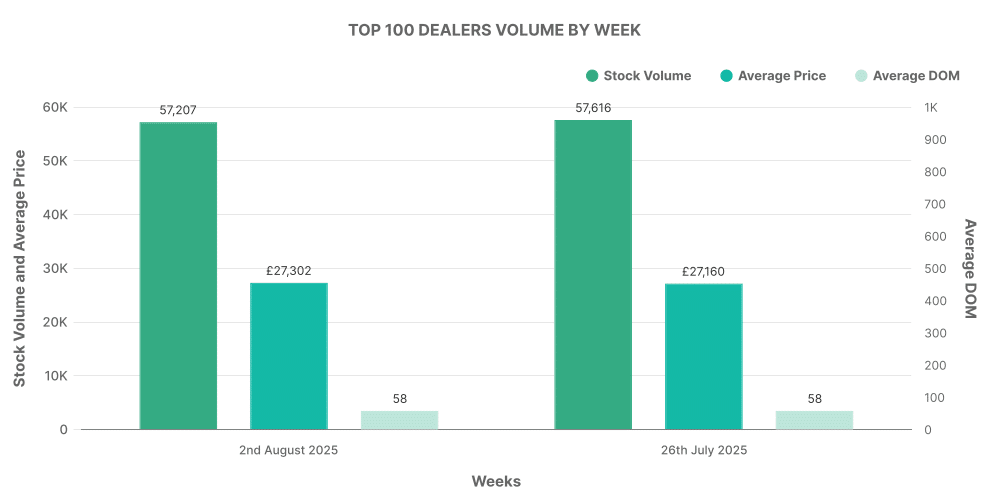
Simultaneously, the electric used car market is continuously evolving. For the same period, from July 26th to August 2nd, there were 4,798 active dealers from 8,265 rooftops leading to 92,625 listings. The average duration on the market for EVs was also 70 days, showing faster turnover than ICE listings, with a significantly higher average price of £26,516. The bulk of the listings were found in the £10,000 – £20,000 and £20,000 – £30,000 categories; 32,578 and 30,809 listings respectively. Most dealers listed between 0-100 cars matching the ICE industry distribution with a few outliers with over 1,000 listings. In the top 100, dealers accounted for 57,207 EV listings, comparable to the total in the ICE market, but selling significantly pricier vehicles.
Comparison: ICE vs EV
The most striking difference between the EV and ICE markets is their price dynamics. While the EV market shows stronger performance through its higher average price, £26,516 over the ICE’s £18,670, it underperforms on total listings with 92,625, compared to 600,559 in the ICE market for the same week. The percentage share for EVs closed at 15.42%, a slight drop from the previous week, with ICE vehicles accounting for the remaining 84.58%.
An analysis of the top 10 advertised vehicles by make and model shows favourites like ‘Toyota Yaris’, ‘Toyota C-HR’, and ‘KIA Niro’ to be the most listed in the EV market.
