Key Points
- Between 30th September and 7th October 2023, the Total Advert Numbers in the market increased from 853,726 to 891,069, indicating a growing market trend.
- The average price of listing showed a slight increase from £18858 to £18948 while there was no change in the Days on Market Average.
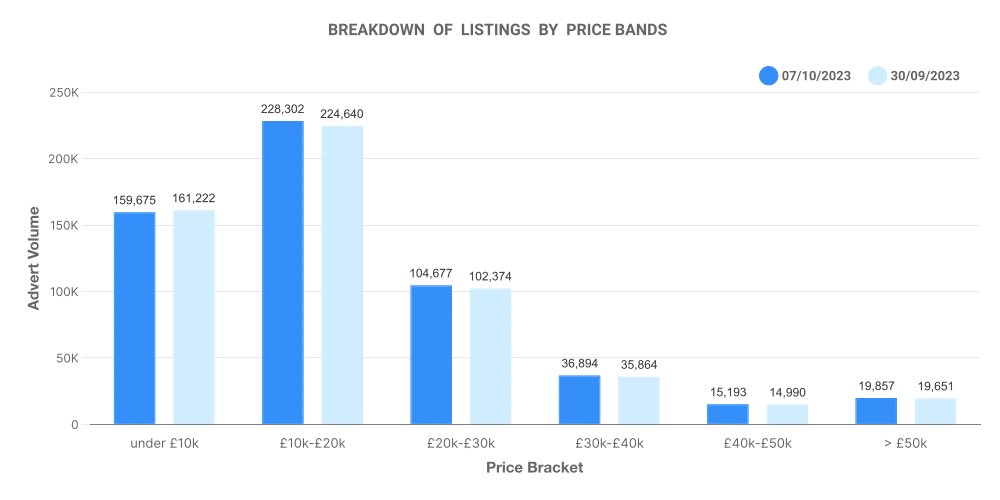
- In the breakdown of listings by bands, there was a noticeable increase in inventories within the £10,001-£20,000 and £30,001-£40,000 price bands, demonstrating a shift towards medium-priced listings.
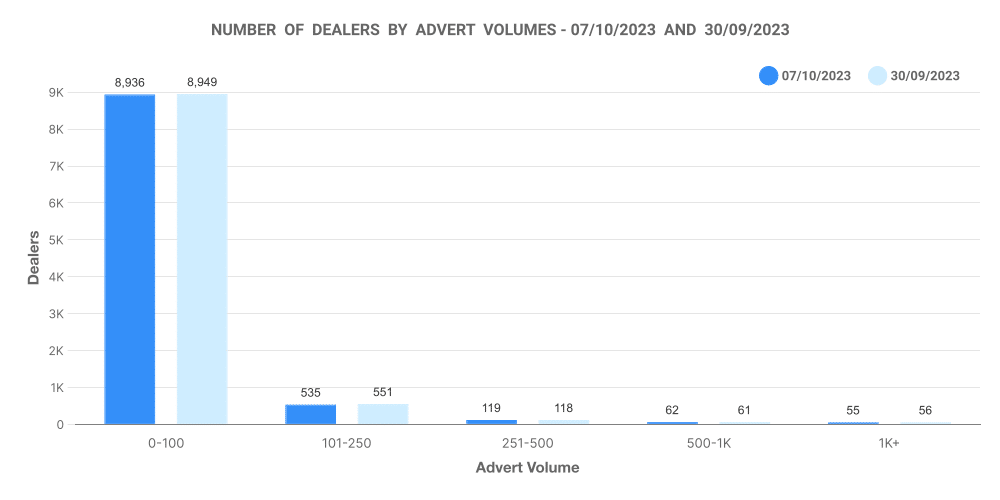
- Analysis of Number of Dealers by advert volumes indicates a stable market, with minor changes in each category.
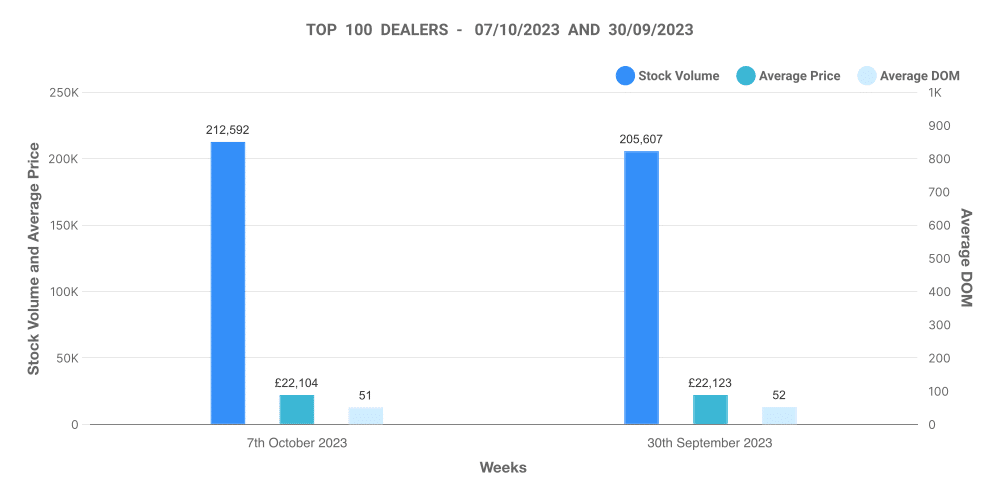
- The Top 100 dealers increased their stock volumes significantly over the period, despite a very slight decrease in average price and Days on Market.
Total Market Analysis
Between 30th September and 7th October 2023, the market saw a slight decrease in Total Dealers and Rooftops, which possibly points at a market consolidation trend. However, Total Advert Numbers saw a significant rise during this same period, moving from 853,726 to 891,069.
Days on Market (DoM) Average
The Days on Market Average remained stagnant at 74 days during both periods. This signifies that on average, it took the same number of days to sell a car across periods.
Breakdown of Listings by Price Bands

Number of Dealers by Advert Volumes

Analysis of Top 100 Dealers by Volume

Price revision data – changes to advert prices
Increases in advert prices outnumbered decreases in both periods. However, the number of price reductions rose notably from 64,255 to 73,663. This may be explained by dealerships adjusting prices to achieve quicker sales.
Conclusion
Overall, the data points to a growing market with stable days on market and balanced dealership advert volumes. This analysis provides valuable insights for both buyers and sellers looking to navigate the car market in October 2023 efficiently.
Next week: 14th October | Annual Analysis: 2022-2023
