Explore the overall market trends, focusing on the internal combustion engine (ICE) and electric vehicle (EV) segments, and see how Marketcheck UK can be a valuable ally in navigating these trends.
Overview of the Used Car Market (ICE)
The UK used car market remains robust, with a slight increase in activity this past week. Here are some key statistics:
- Total Dealers: The number of dealers remains steady at around 10,505, with a small decrease from the previous week’s 10,513.
- Total Listings: Listings saw an increase to 876,876 from 836,351, marking a 4.84% rise.
- Average Days on Market (DOM): There was a marginal decrease in the average days on market, dropping from 84 to 83 days, indicating slightly quicker sales.
- Average Price: The average price of used cars in the UK market remained stable at around £18,057, showing a negligible change from £18,071.
Breakdown of Listings by Price Bands
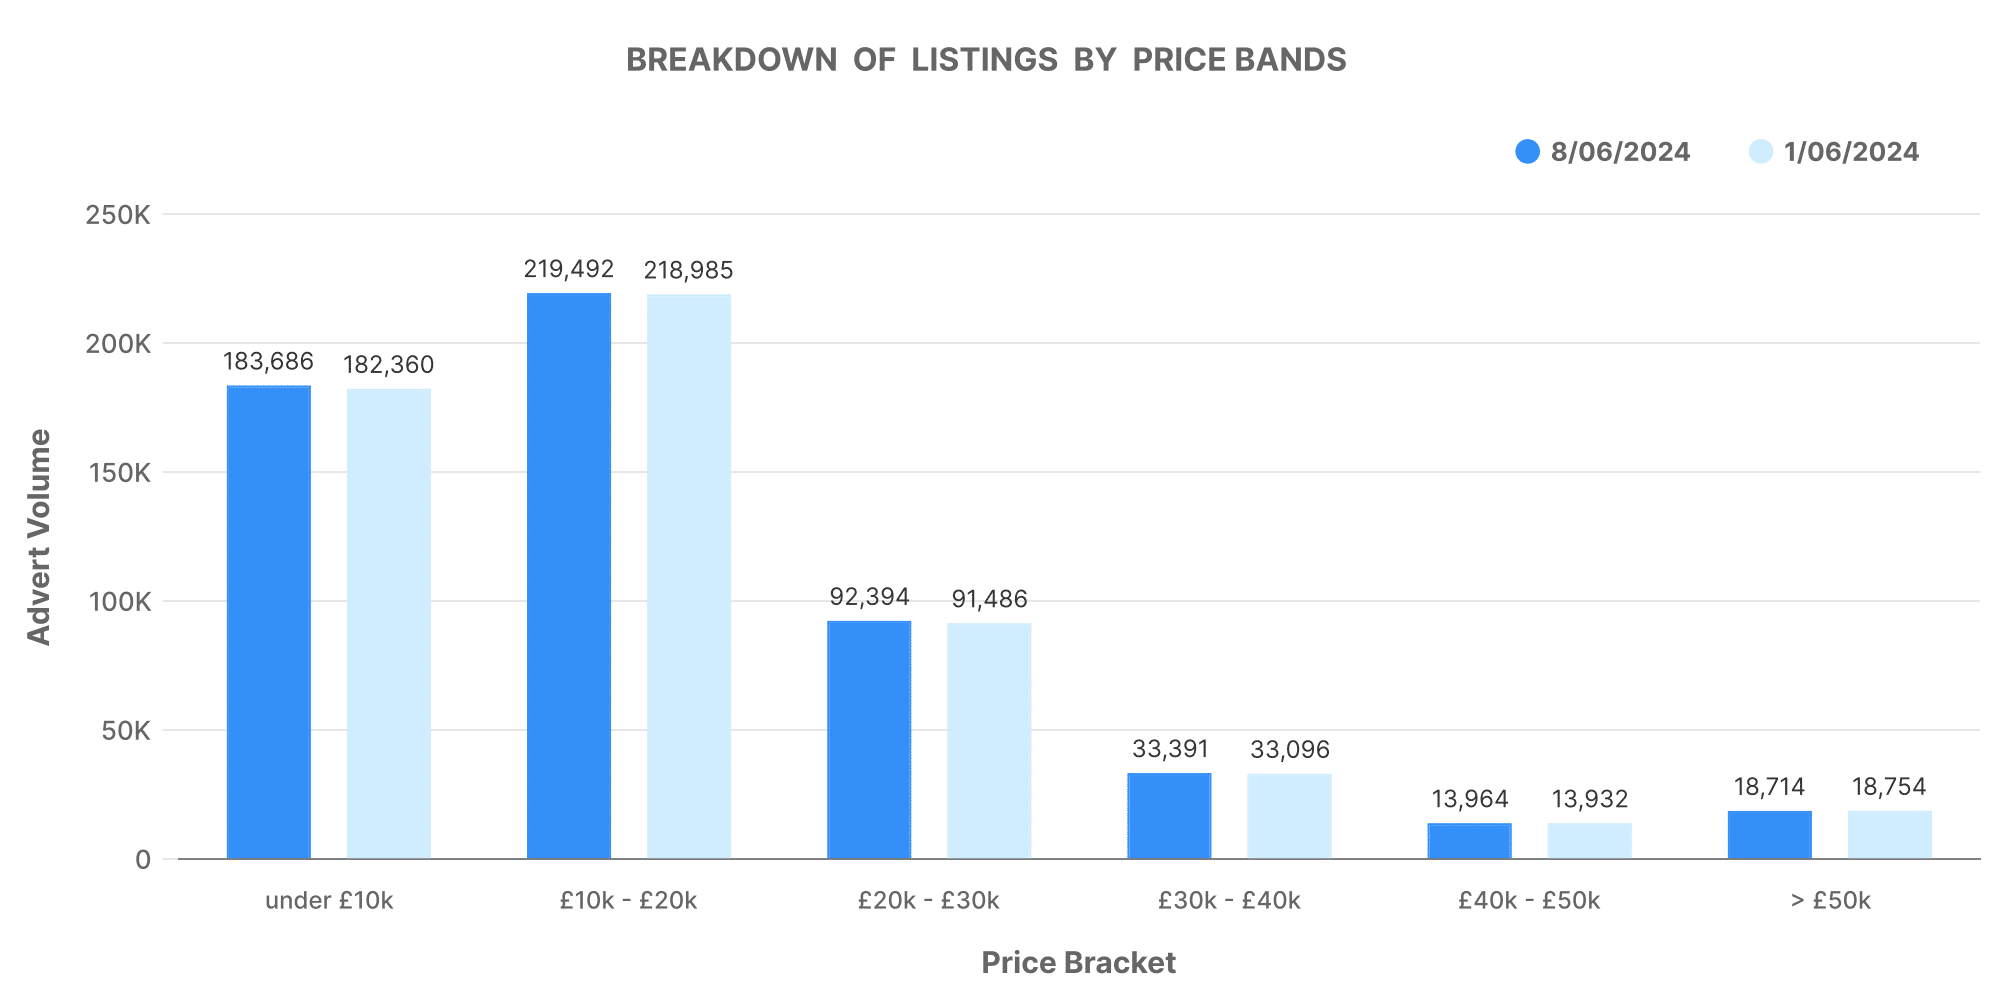
The distribution of car listings across various price bands offers insights into consumer affordability and dealer stock strategies:
- £0-£10K: 183,686 listings (up from 182,360)
- £10-£20K: 219,492 listings (up from 218,985)
- £20-£30K: 92,394 listings (up from 91,486)
- £30-£40K: 33,391 listings (up from 33,096)
- £40-£50K: 13,964 listings (up from 13,932)
- £50K+: 18,714 listings (slightly down from 18,754)
Number of Dealers by Advert Volumes
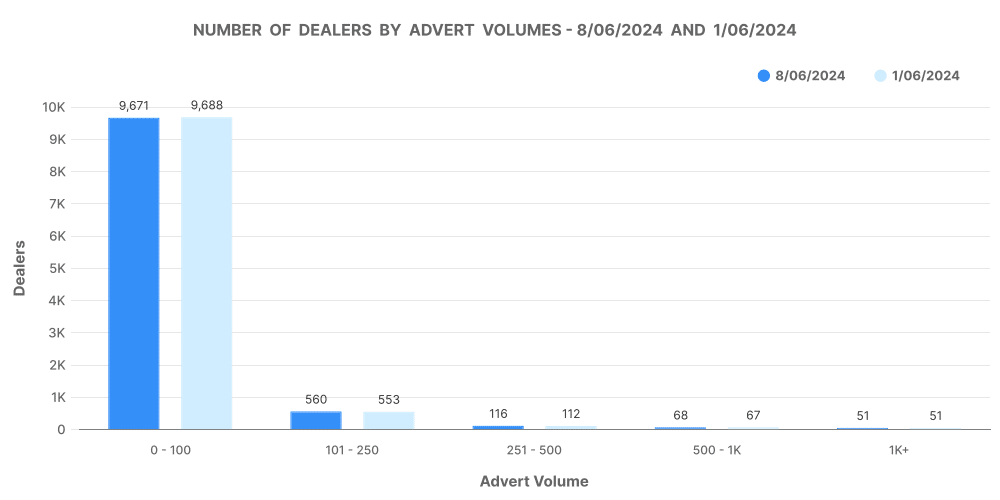
Dealer inventory volumes also provide a snapshot of market health:
- 0-100 cars: 9,671 dealers (slightly down from 9,688)
- 101-250 cars: 560 dealers (up from 553)
- 251-500 cars: 116 dealers (up from 112)
- 500-1,000 cars: 68 dealers (up from 67)
- 1,000+ cars: 51 dealers (unchanged)
Analysis of Top 100 Dealers by Volume
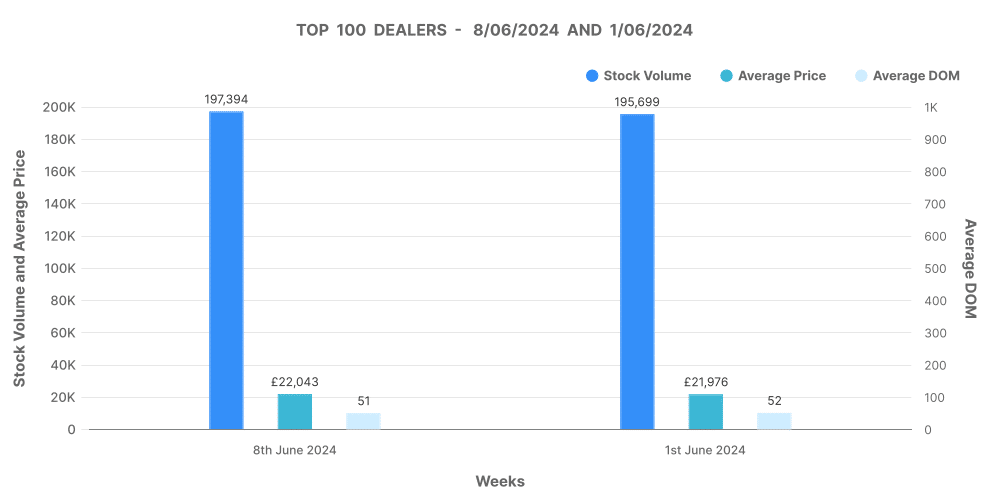
- Stock Volume: Increased to 197,394 from 195,699.
- Average DOM: Decreased to 51 days from 52.
- Average Price: Increased marginally to £22,043 from £21,976.
- Price Increases: Up significantly to 18,353 from 12,509.
- Price Decreases: Also up to 66,659 from 57,816.
Overview of the Electric Used Car Market (EV)
The electric vehicle market continues to grow, reflecting the broader automotive industry’s shift towards sustainability. Here’s what the latest data reveals:
- Total Dealers: Slightly decreased to 4,312 from 4,319.
- Total Listings: Increased to 126,336 from 118,831, showing a 6.31% rise.
- Average DOM: Improved to 69 days from 71, indicating faster turnover.
- Average Price: Remained stable around £27,491.
Breakdown of Listings by Price Bands
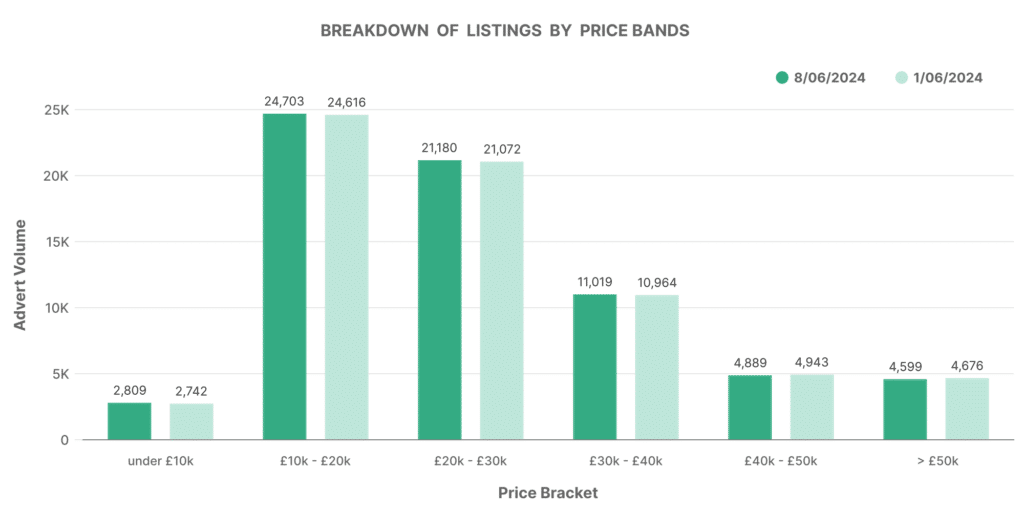
Electric vehicles show a distinct price distribution compared to ICE vehicles:
- £0-£10K: 2,809 listings (up from 2,742)
- £10-£20K: 24,703 listings (up from 24,616)
- £20-£30K: 21,180 listings (up from 21,072)
- £30-£40K: 11,019 listings (up from 10,964)
- £40-£50K: 4,889 listings (down from 4,943)
- £50K+: 4,599 listings (down from 4,676)
Number of Dealers by Advert Volumes
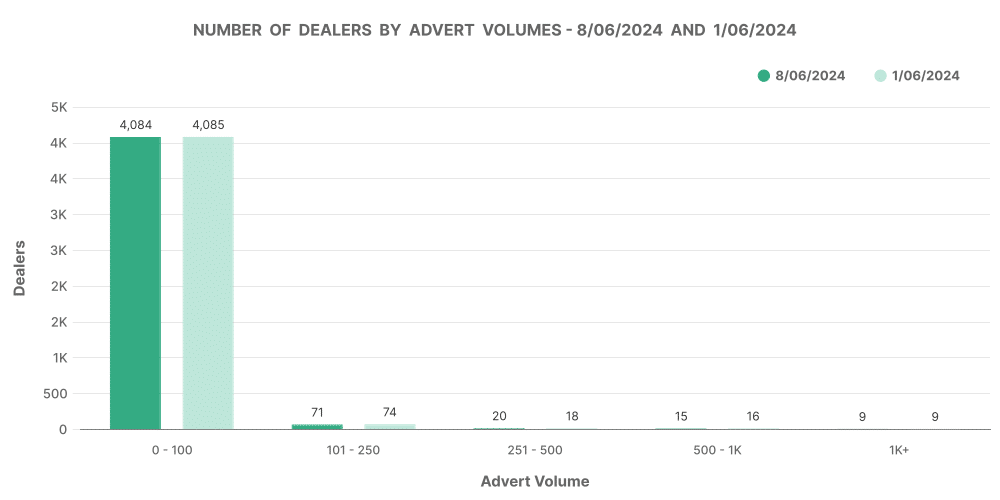
The EV market also exhibits a varied dealer inventory:
- 0-100 cars: 4,599 dealers (down from 4,676)
- 101-250 cars: 4084 dealers (slightly down from 4085)
- 251-500 cars: 71 dealers (down from 74)
- 500-1,000 cars: 20 dealers (up from 18)
- 1,000+ cars: 15 dealers (slightly down from 16)
Analysis of Top 100 Dealers by Volume
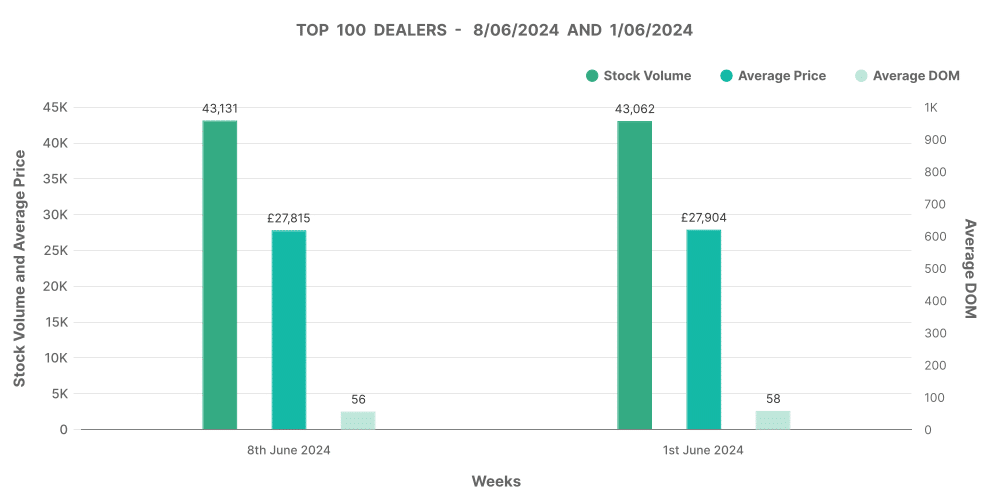
- Stock Volume: Slightly up to 43,131 from 43,062.
- Average DOM: Improved to 56 days from 58.
- Average Price: Marginally decreased to £27,815 from £27,904.
- Price Increases: Up significantly to 2,498 from 2,005.
- Price Decreases: Also up to 15,836 from 13,002.
Comparing ICE and EV Markets
The percentage share of EVs in the UK used car market is holding steady at 12.36%, slightly down from 12.39%. In contrast, ICE vehicles maintain a dominant share at 87.64%. The average price of EVs is notably higher at £27,491 compared to £16,731 for ICE vehicles. This price difference reflects the newer technology and higher demand for sustainable options.
Relevance of Marketcheck UK
Marketcheck UK stands out as a crucial resource for dealers aiming to stay ahead in this competitive landscape. With comprehensive data on every current and historical used car advert listing in the UK, Marketcheck UK provides invaluable insights that help dealers:
- Optimise Inventory: Understand market trends and adjust stock levels accordingly.
- Set Competitive Prices: Use real-time data to set prices that attract buyers and maximise profits.
- Track Performance: Monitor key metrics like average DOM and price changes to fine-tune sales strategies.
- Stay Ahead: Leverage the latest market data to anticipate changes and adapt quickly.
Marketcheck UK’s data delivery options, including CSV feeds, APIs, website tools, and spreadsheet analysis tools, ensure that dealers have access to the most relevant information in the format that best suits their needs. By partnering with Marketcheck UK, dealers can enhance their decision-making process, improve inventory management, and ultimately boost their sales and profitability.
