
Understanding the current state of the UK used car market is crucial for automotive dealers aiming to optimise their inventory and pricing strategies. This report delves into the latest data for both Internal Combustion Engine (ICE) vehicles and Electric Vehicles (EVs), highlighting key trends and offering insights that can help dealers make informed decisions.
ICE Vehicles Market Overview
The traditional ICE vehicle market continues to dominate the used car sector in the UK. For the week ending 24th August 2024, the total number of ICE vehicle listings stood at 898,791 across 10,734 dealers. This represents a slight decrease in total listings compared to the previous week, which had 909,833 listings. The average days on market (DOM) increased slightly from 84 to 85 days, indicating that vehicles are taking marginally longer to sell.
The average price of used ICE vehicles during this period was £17,967, reflecting a minor decrease from the previous week’s average of £18,097. This slight dip in average price could be attributed to a higher proportion of lower-priced vehicles being listed.
Breakdown of Listings by Price Bands
Examining the price band volumes reveals the following distribution of ICE vehicle listings:
- £0-10K: 192,506 listings
- £10-20K: 222,393 listings
- £20-30K: 98,980 listings
- £30-40K: 34,683 listings
- £40-50K: 13,727 listings
- £50K+: 18,437 listings
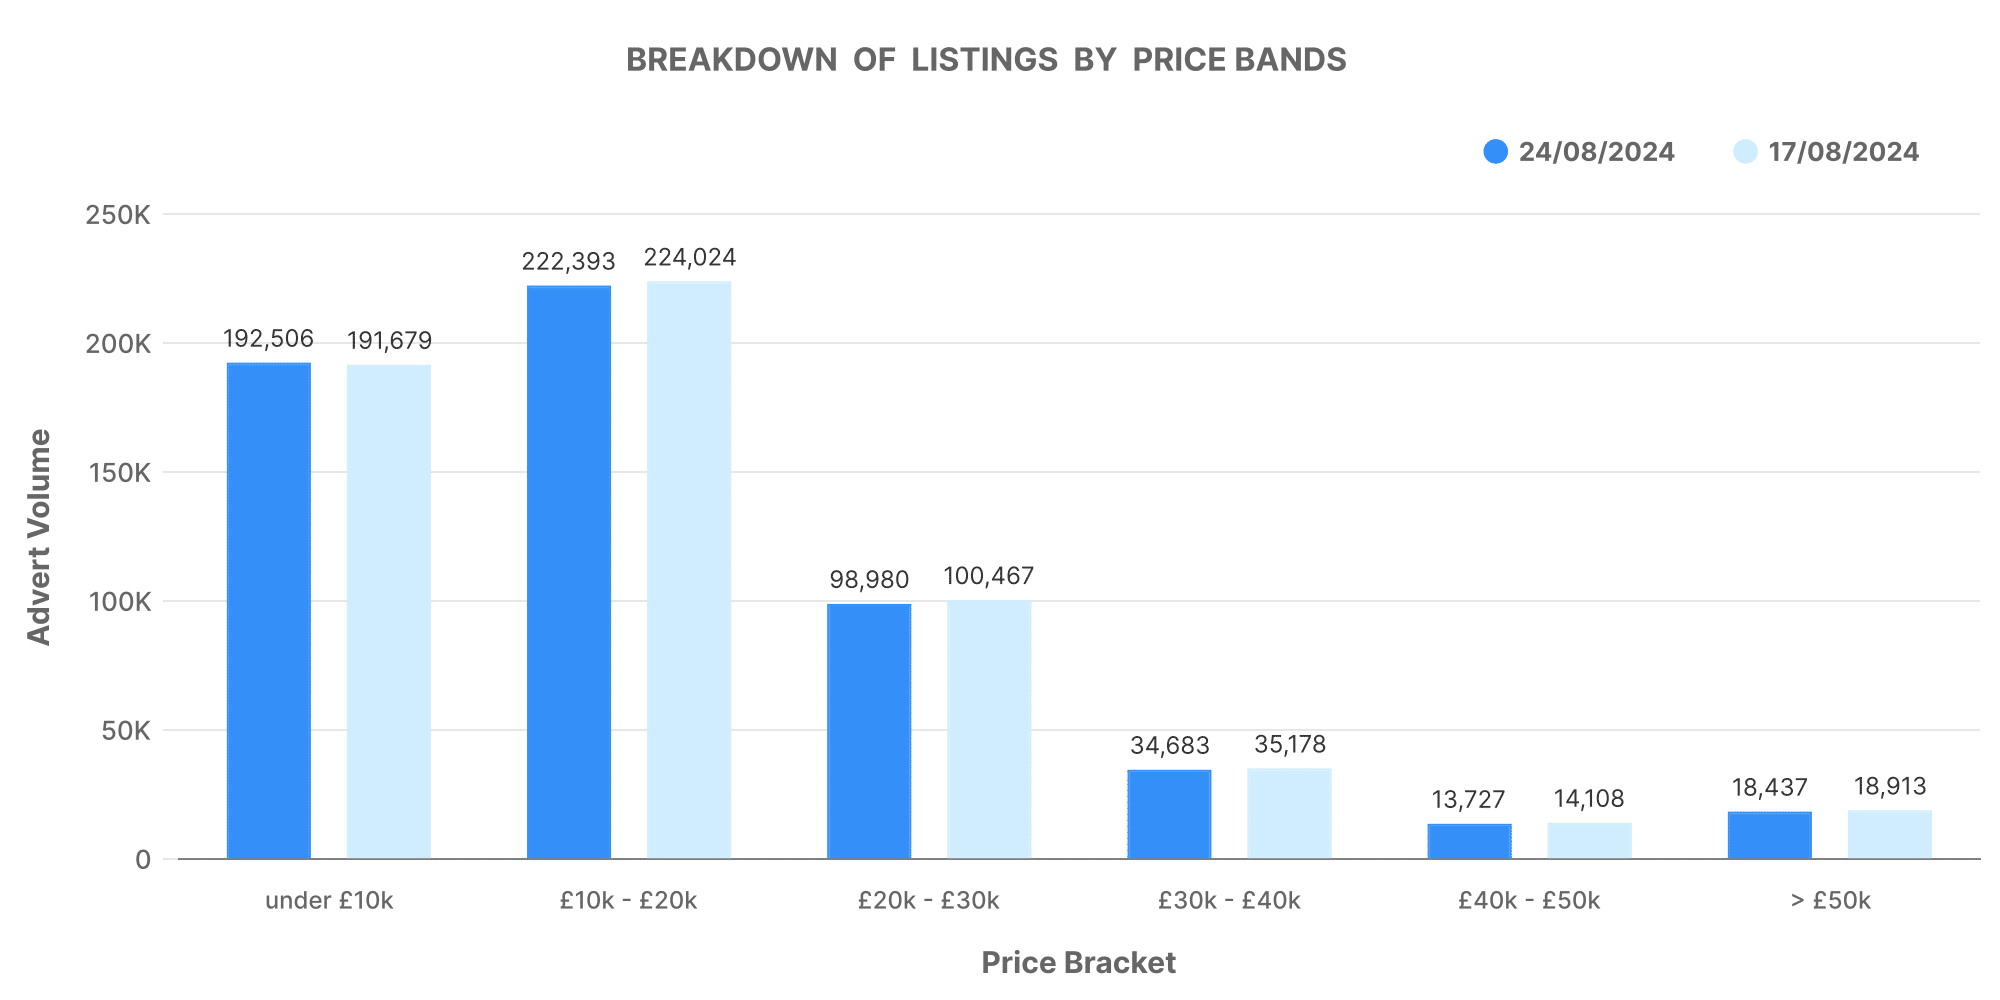
These figures suggest that the majority of the market activity is concentrated in the £10K-20K and £20K-30K price bands, accounting for nearly half of all listings. The top 100 dealerships by volume are holding steady with a combined stock volume of 202,241 vehicles and an average price of £21,733, slightly lower than the previous week.
Number of Dealers by Advert Volumes
The distribution of inventory volume across dealers is as follows:
- 0-100 vehicles: 9,908 dealers
- 101-250 vehicles: 550 dealers
- 251-500 vehicles: 126 dealers
- 500-1K vehicles: 59 dealers
- 1K+ vehicles: 52 dealers

The majority of dealers continue to operate with smaller inventories, with over 90% holding fewer than 100 vehicles. This fragmented market structure underscores the competitive nature of the industry, where small to mid-sized dealers dominate.

EV Market Overview
The EV market, while smaller than the ICE segment, is growing steadily. For the week ending 24th August 2024, there were 130,465 EV listings, a slight reduction from the previous week’s 133,765 listings. The number of dealers listing EVs remained relatively stable, with 4,407 dealers contributing to the market.
The average days on market for EVs was 69 days, unchanged from the previous week, indicating stable demand. The average price of EVs saw a slight decrease to £27,111, down from £27,253 in the previous week.
Breakdown of Listings by Price Bands
The price band distribution for EV listings is as follows:
- £0-10K: 3,225 listings
- £10-20K: 25,260 listings
- £20-30K: 22,782 listings
- £30-40K: 11,480 listings
- £40-50K: 4,645 listings
- £50K+: 4,296 listings

Similar to ICE vehicles, the majority of EV listings fall within the £10K-30K price range. However, there is a noticeable presence of higher-end EVs in the £30K-50K+ range, reflecting the broader price spectrum that EVs typically occupy due to their newer technology and higher production costs.
Number of Dealers by Advert Volumes
Inventory distribution among EV dealers is more evenly spread compared to ICE vehicles:
- 0-100 vehicles: 4,296 dealers
- 101-250 vehicles: 72 dealers
- 251-500 vehicles: 21 dealers
- 500-1K vehicles: 13 dealers
- 1K+ vehicles: 10 dealers

The smaller inventory bands are heavily populated, similar to the ICE market. However, the proportion of dealers with larger inventories is slightly higher in the EV segment, which may indicate that dealers specialising in EVs are more likely to carry larger stocks.

Comparative Analysis: ICE vs. EV
The share of EVs in the overall used car market remains modest but is growing steadily. As of the week ending 24th August 2024, EVs accounted for 12.29% of all used car listings, down slightly from 12.42% the previous week. In contrast, ICE vehicles continue to dominate with 87.71% of the market.
The average price of EVs (£27,111) remains significantly higher than that of ICE vehicles (£17,967), reflecting the ongoing premium associated with electric technology. However, the gap between the average prices of EVs and ICE vehicles is narrowing as more affordable EV models enter the market and depreciation on older EVs begins to take effect.
Market Insights for Dealers
For automotive dealers, understanding these trends is crucial. The slight increase in average DOM for ICE vehicles suggests that pricing strategies may need adjustment to improve turnover. With a significant concentration of listings in the £10K-20K and £20K-30K price bands, dealers might consider focusing their acquisitions and marketing efforts in these segments to capitalise on market demand.
For those dealing in EVs, the stable demand and relatively quick turnover—69 days on average—indicate a healthy market. The higher price points for EVs present an opportunity for dealers to increase margins, especially as more consumers shift towards electric vehicles. However, the market is still young, and price sensitivity remains a factor, so dealers should carefully monitor price trends and adjust their strategies accordingly.
How Marketcheck UK Can Help
Marketcheck UK offers comprehensive data and insights that are invaluable for automotive dealers. With our detailed analytics on current and historical used car listings, you can make informed decisions about your inventory, pricing, and marketing strategies. Whether you’re dealing in ICE vehicles or EVs, our data tools provide the clarity you need to stay competitive in a fast-evolving market.
By leveraging Marketcheck UK’s data, you can optimise your stock based on real-time market trends, adjust pricing strategies to maximise sales, and identify which segments to focus on for future growth. Our services, including CSV feeds, APIs, and advanced analytics tools, are designed to give you a clear edge in the UK used car market.
With the right data at your fingertips, you can navigate the complexities of the used car market with confidence, ensuring that your dealership remains ahead of the curve.
Next week: 31st August | Previous week: 17th August