Unveiling the Automotive Landscape for ICE Vehicles
The used car market in the UK has always been superbly dynamic, buzzing with transactions and teeming with a diverse range of vehicles. Let’s take a quick look at some facts about Internal Combustion Engine (ICE) vehicles in the week spanning from 28th September to 5th October.
Interestingly, there were 10,652 dealers brimming with a total of 958,131 listings. Averagely, a vehicle priced at £18,280 spent around 84 days on the market before being snapped up by a buyer. Let’s break this down a bit further according to price bands:
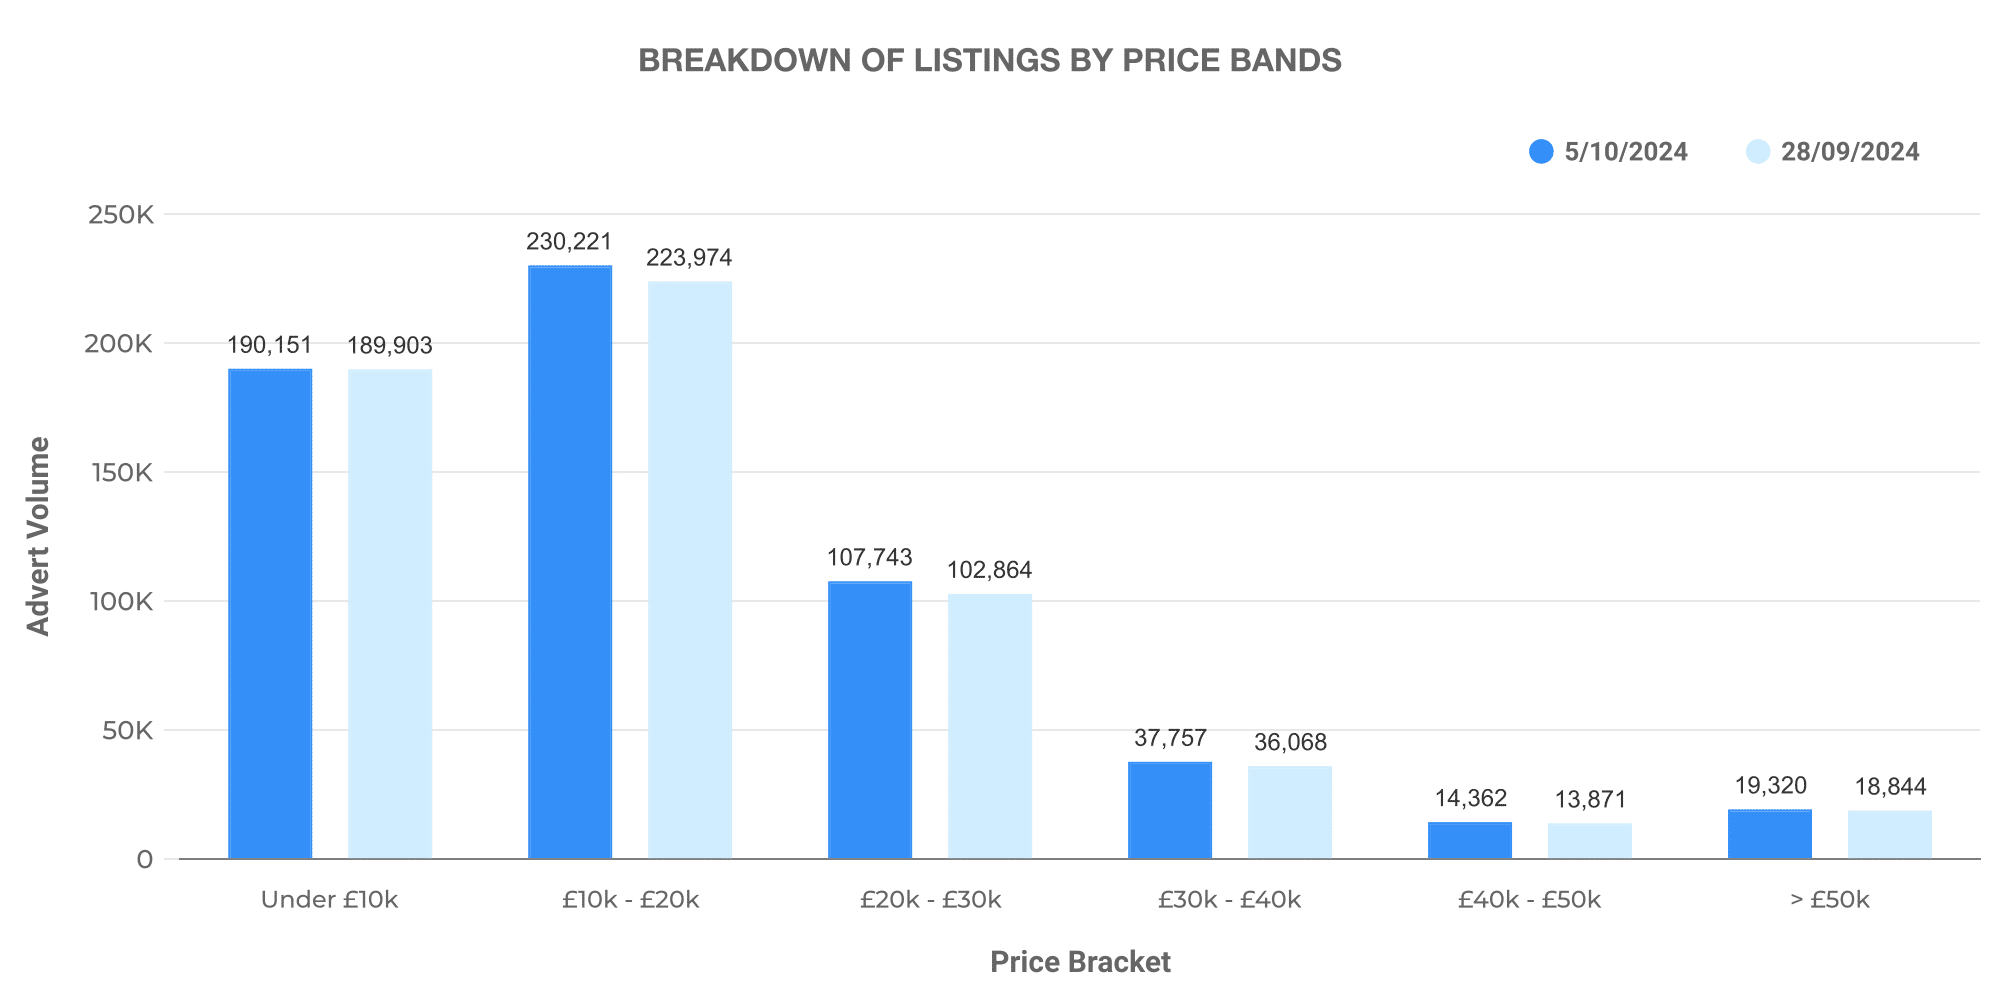
- Vehicles priced between £0-10K were most commonly listed, with 190,151 listings.
- Next up were the £10-20K vehicles, with 230,221 listings.
- The £20-30K range had 107,743 listings.
- The £30-40K and £40-50K price bands reported 37,757 and 14,362 listings respectively.
- Finally, the premium segment (£50K+) consisted of 19,320 listings.
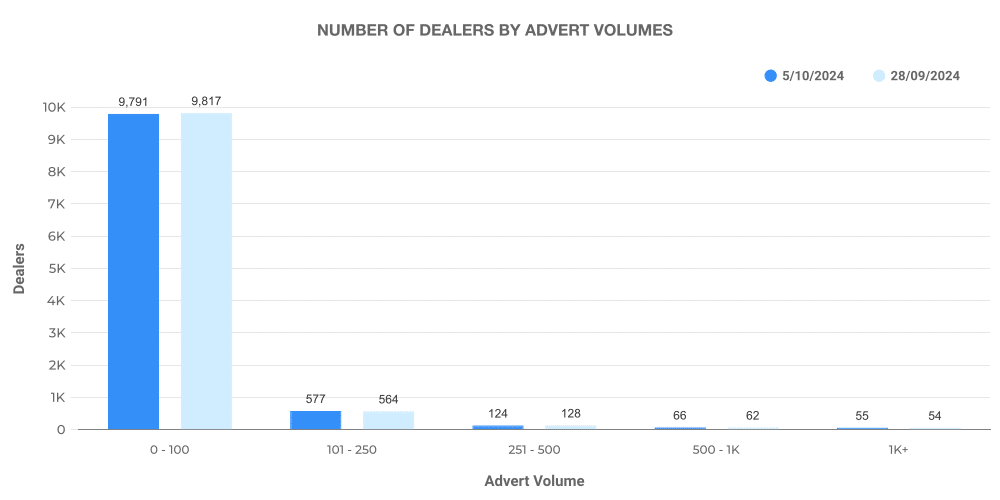
Let’s also glance at the number of dealers by their advert volumes:
Energising the Market: Electric Vehicles (EVs)
In terms of the electric used car market analysis, a total of 4,359 dealers constituted a whopping 134,802 listings. On average, an electric vehicle, priced at a slightly steeper £27,157, spent 65 days on the market before finding its new owner. Slicing by price bands, the electric used cars are showcased as below:
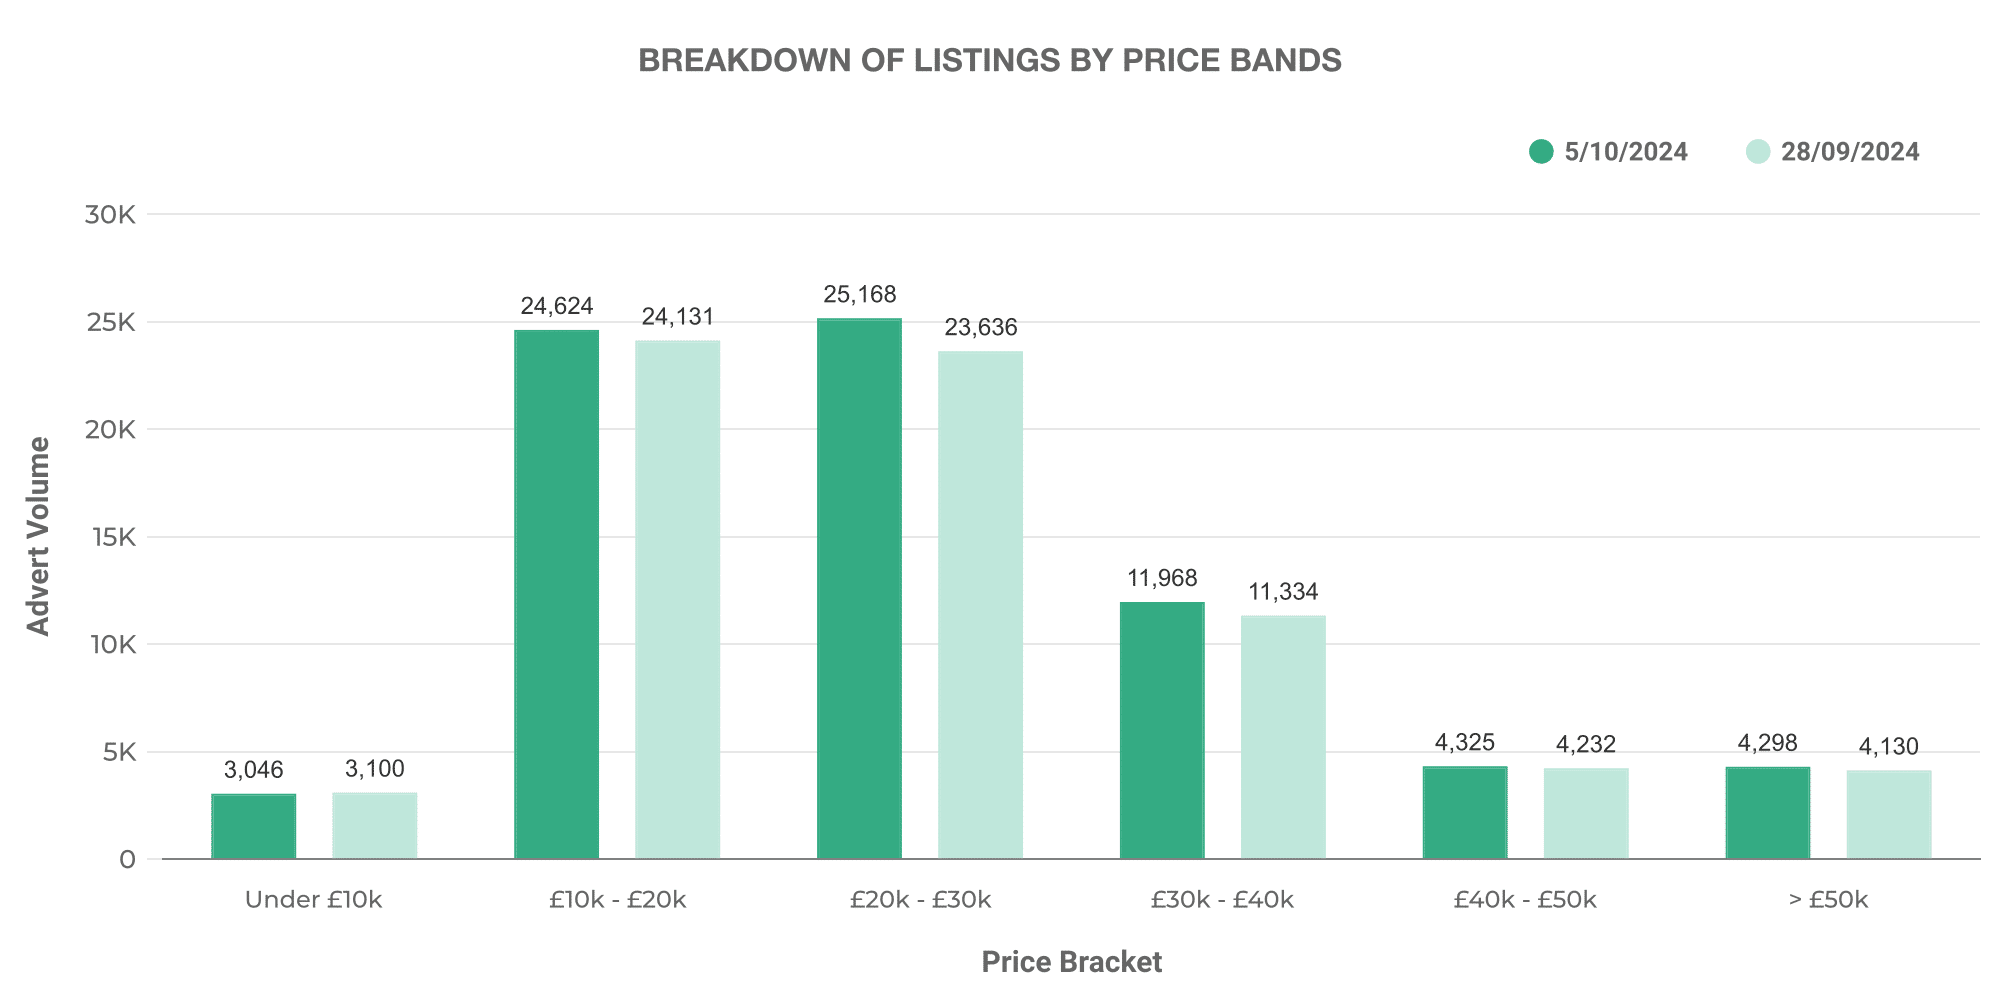
- Electric cars in the £0-10K bracket had 3,046 listings.
- A significant 24,624 listings were seen in the £10k-20K range.
- Furthermore, listings for £20-30K, £30-40K, £40-50K, and £50K+ vehicles were 25,168, 11,968, 4,325 and 4,298 respectively.
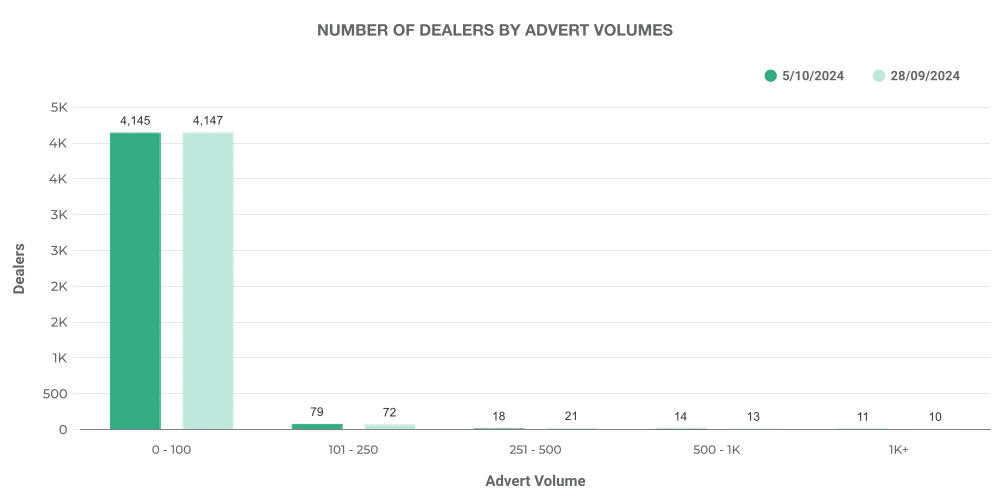
The landscape of dealers by advert volumes for electric cars looks somewhat like this:
ICE vs EV: Key Comparisons
Interestingly, there is a noticeable difference between the behaviours of the ICE and electric used car markets:
- When it comes to the number of listings, ICE cars (958,131 listings) comfortably outnumber their electric counterparts (134,802 listings).
- Electric vehicles also demonstrate quicker market absorption with an average of 65 days on the market, lower than the 84 days for ICE vehicles.
- Significantly, electric cars command a higher average price (£27,157) than their ICE counterparts (£18,280), likely due to their inherent efficiency, low running costs, and popularity in light of the global sustainability drive.
The Role of Marketcheck UK
For UK automotive dealers seeking to make the best purchasing decisions in such a vibrant and competitive landscape, Marketcheck UK is your trusted companion. We offer comprehensive analysis on every current and historical used car advert listing in the UK. Our data – whether through CSV feeds, APIs, Website Tools, Spreadsheet and Looker analysis tools or third party APIs – can be the game-changer in your gameplay!
Whether you’re bargaining for a better buy price or strategising for a swifter sale, Marketcheck UK lets you peek into the future, bringing trends and insights right at your fingertips. Now, that’s what we call empowering automotive dealers to leap ahead!
Top 100 Dealers: ICE vs EV
Let’s take a look at how the Top 100 Dealers in the respective categories perform.
For ICE vehicles:
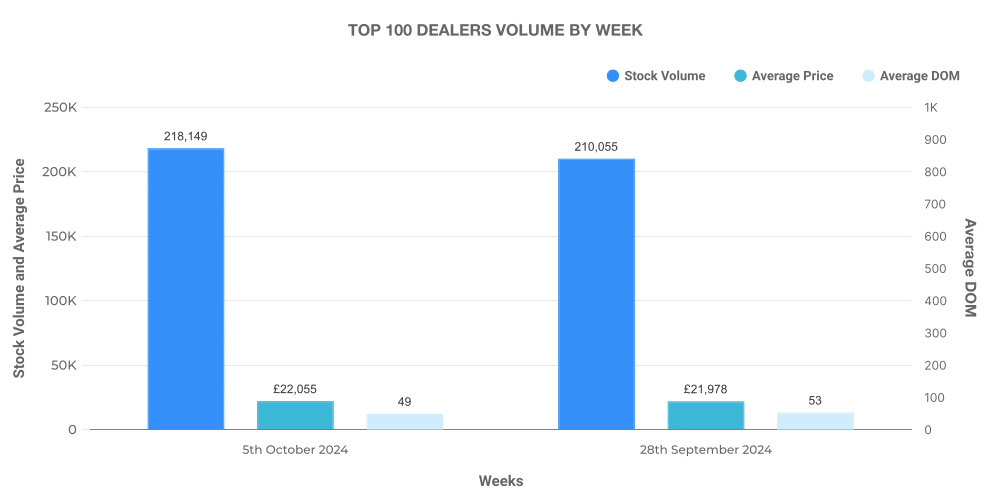
Similarly, for electric vehicles:
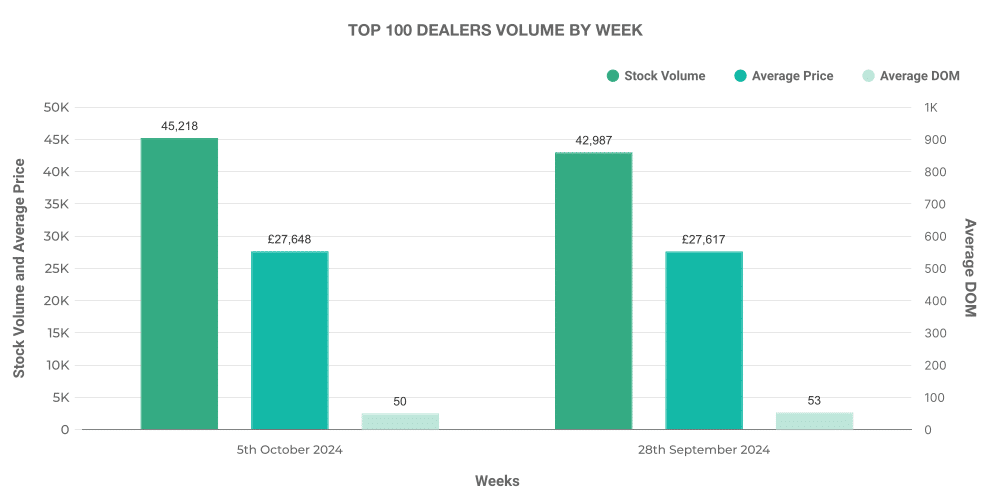
These graphs provide an insight into the size and engagement of the dealer network in the UK car industry, highlighting trends that are essential when formulating effective sales strategies.
At Marketcheck UK, we’re all about simplifying your road to smart, data-driven decisions. Our data and analytics drive confident decisions and successful outcomes, steering you in the right direction in the UK’s used car market, be it ICE or Electric. Feel free to reach out to us to learn more!
Next week: 12th October | Previous month: September 2024
