
UK Weekly Used Car Market Data – October 2024
A detailed analysis of the latest data in the used car market is paramount for all businesses working in the UK’s automotive sector. These insights offer a clearer understanding of current trends, creating a foundation for insightful decision making. This report will focus on the data from the week ending 26th October 2024, providing automotive market insights into the Internal Combustion Engine (ICE) vehicles and Electric Vehicles (EV) trends.
Insights into the ICE Used Car Market
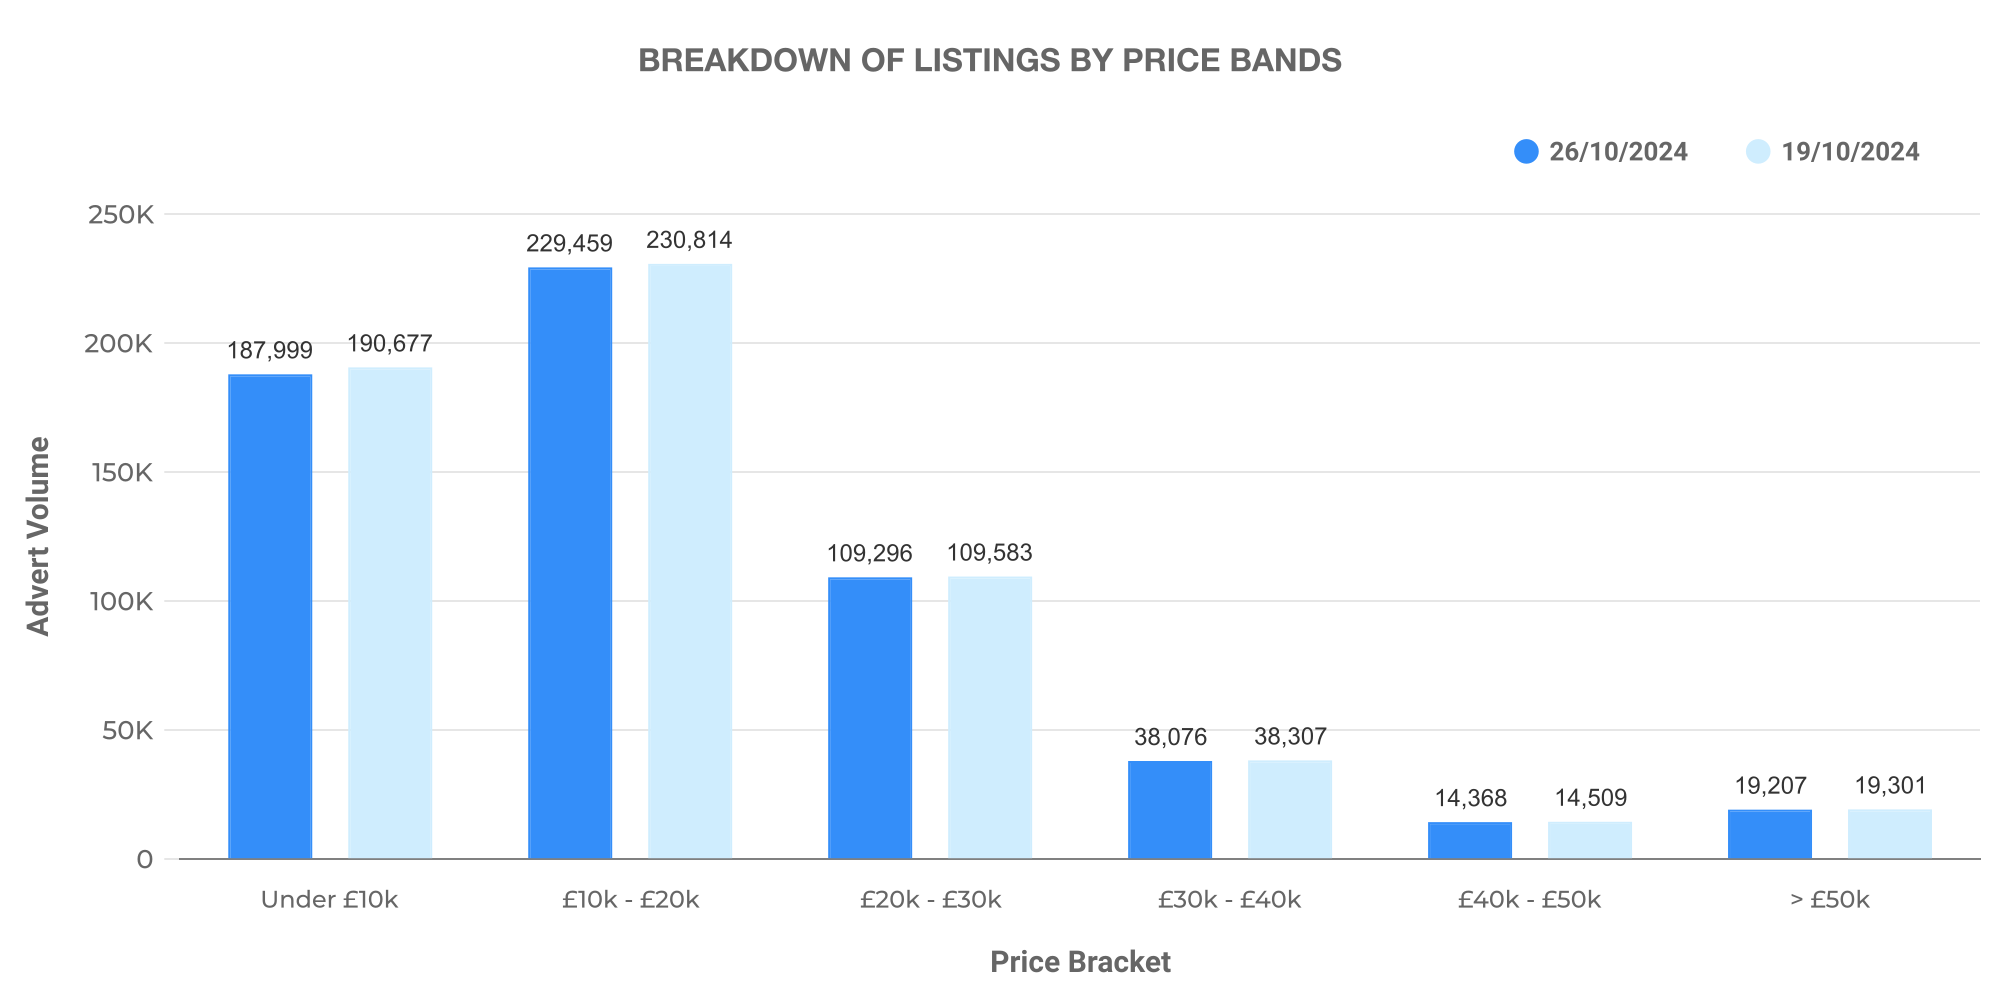
During the week ending 26th October, there were 611,354 used ICE listings reported across 10,629 dealers. Although we saw a slight decline compared to the previous week, the total rooftop count increased, indicating a growth in the number of active sales locations.
The graphic illustrates the variation in used car pricing – majority are listed within the £10,000 – £20,000 range. Although there’s a drop in numbers, we see a significant presence of cars priced within the £20,000 – £30,000 range. Cars priced above £50,000 also continue to contribute to the market.
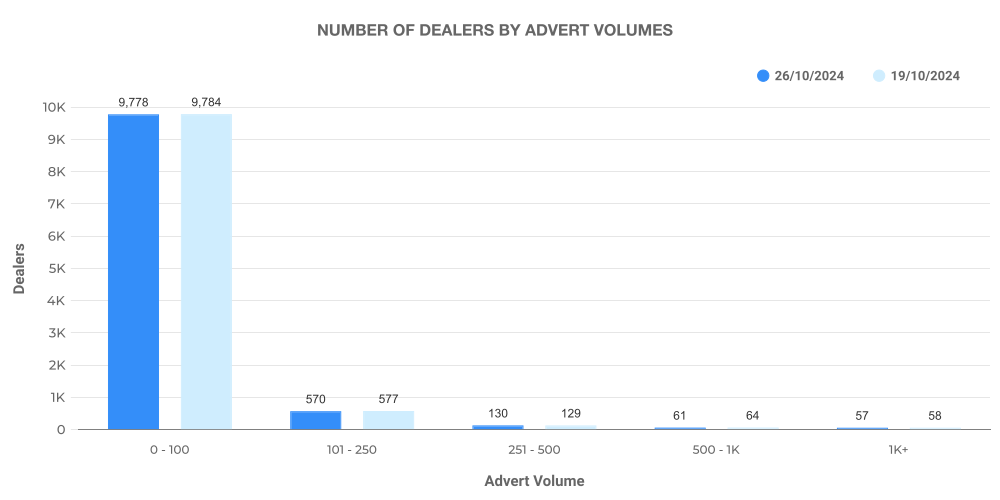
The segment for dealer volumes further illustrates the presence of varied dealership capacities. Comparison with previous week’s data shows an increased balance amongst dealers, offering a range of capacities and options for potential consumers.
Looking into Electric Used Car Market
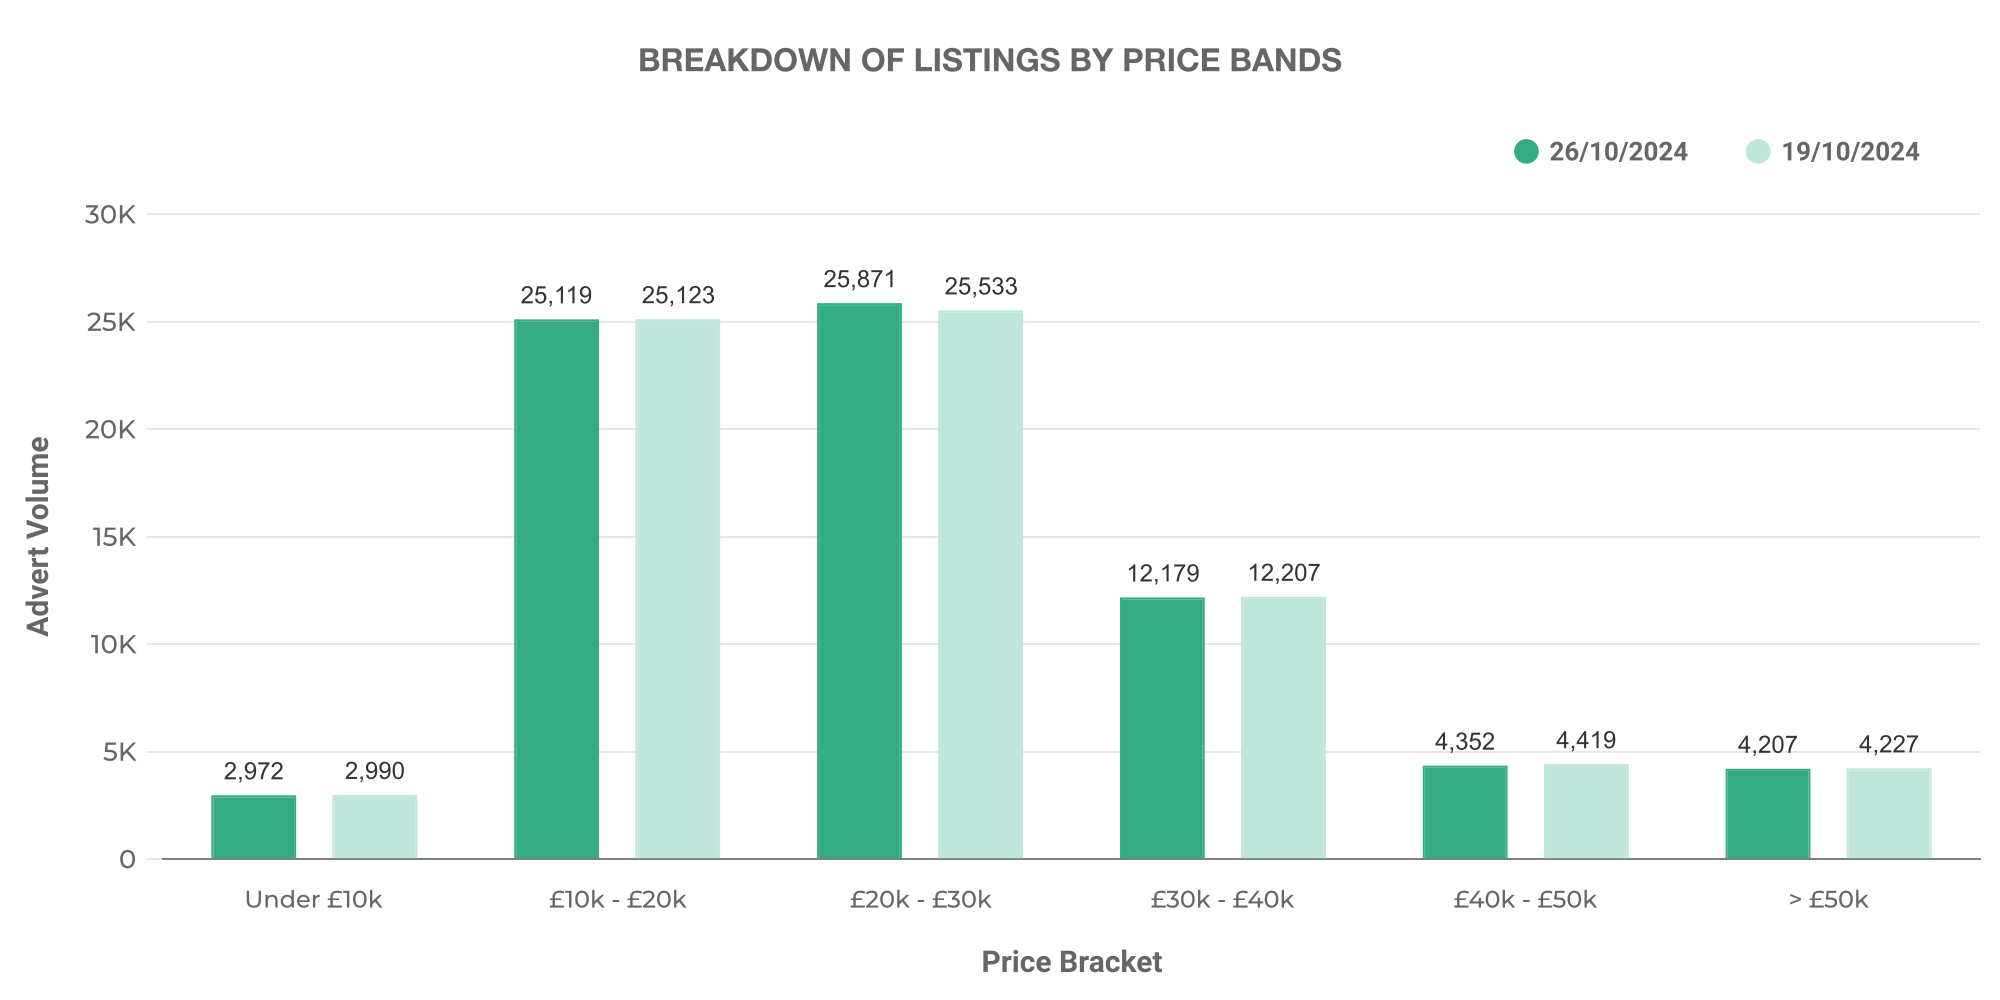
The data from the week ending on 26th October introduces a total of 75,879 used EV listings, just slightly above the previous week, reported by 4,330 dealers.
The pricing for used EV listings tends to be more diverse. While the majority of listings are seen within the £10,000 – £20,000 bracket, there are still a high number of listings in the £20,000 – £30,000 range. Motors above £50,000 mark their presence in the market too.
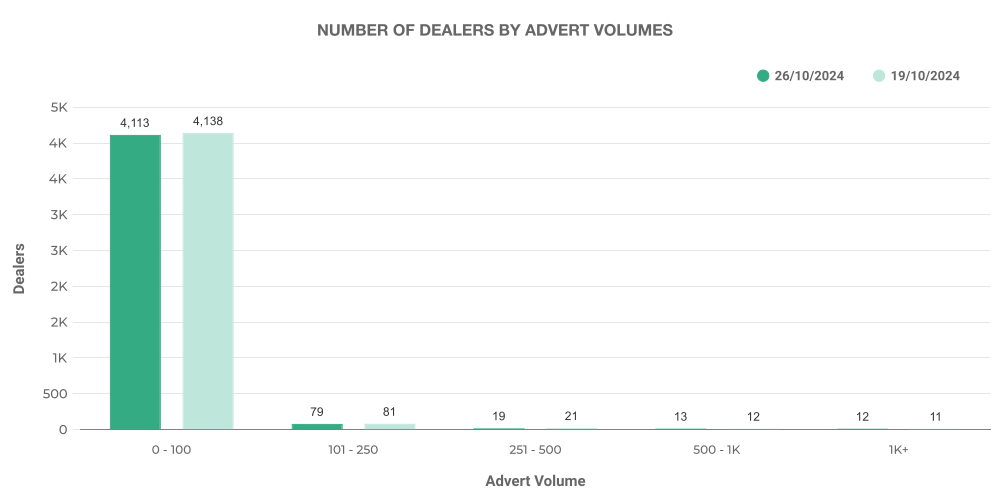
EV dealer volume data shows an abundance of listings from dealerships with 0-100 vehicles in their inventory. This shift points towards the relatively new nature of the EV market, highlighting the potential for growth.
Comparison: ICE vs EV
To demonstrate the contrast between the two types of vehicles thoroughly, let’s analyse the top 100 dealerships by listing volume for EVs and ICE vehicles.
The top 100 ICE dealers accounted for 35.3% of total ICE listings. Their average listing price (£22,226) also remains higher than the general market average.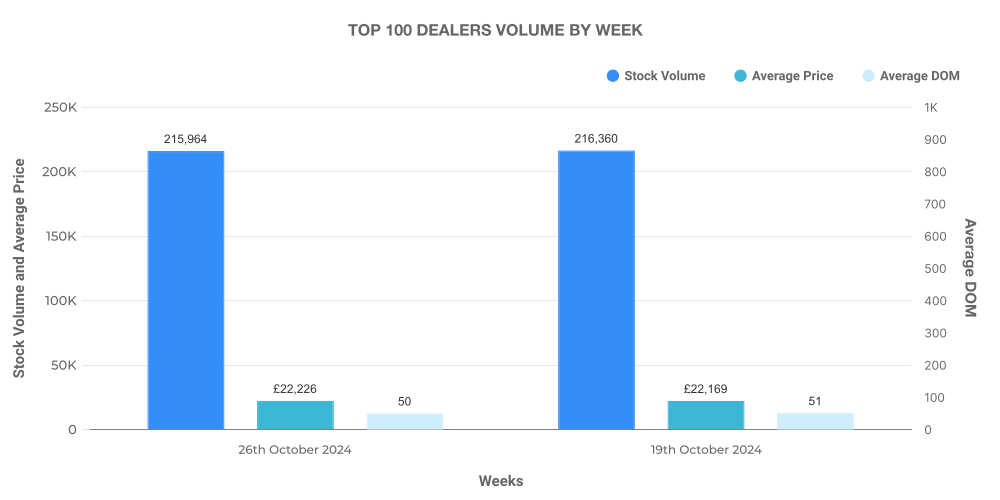
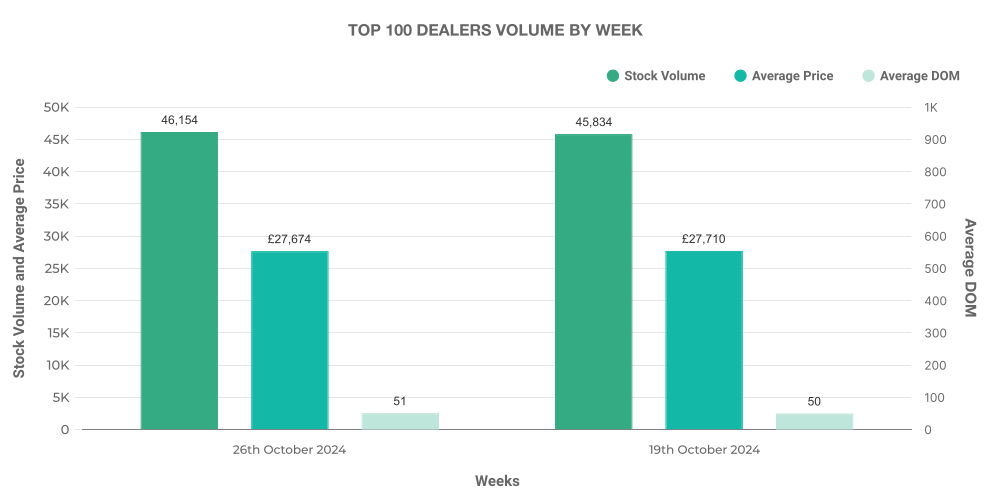
However, data from the top 100 EV dealers offers a different story. These dealers only make up 61% of total EV listings, confirming a relatively diverse market. Despite this, their average price (£27,674) stands noticeably higher than the average EV market price.
Closing Thoughts
Despite being in different stages of maturity, both the ICE and EV markets show promising signs of stability and growth. The data’s nuances translate into practical automotive market insights, paving the way for strategised decision-making for businesses within the UK automotive sector.
To delve into the data further, or to discuss how Marketcheck UK can assist your business, please get in touch. Our comprehensive data sets, available through CSV feeds, APIs, spreadsheets and analysis tools, offer an in-depth understanding of the UK automotive market.
Next week: 2nd November | Previous week: 19th October