UK Weekly Used Car Market Data – Week 47 of 2024
Understanding the shifts and trajectories in the used car market is of paramount interest to all in the UK automotive sector. Detailed observations of these trends empower car dealers, insurance companies, auction businesses, and finance lenders and brokers to make more informed decisions. In particular, the balance between conventional internal-combustion engine vehicles (ICE) and electric vehicles (EVs) is a topic of increasing relevance. This report provides a detailed analysis of the weekly data on used car trends.
UK Used Car Market: Internal-Combustion Engine Vehicles (ICE)
The week from 16th November to 23rd November saw a total of 607,053 used ICE cars listed by 10,527 dealers. The price band volume manifested a similar pattern as previous weeks, with the majority of listed cars falling under the £10,000 – £20,000 range, followed by those priced £20,000 – £30,000. Higher-ticket cars were lesser, implying a balanced market demand.
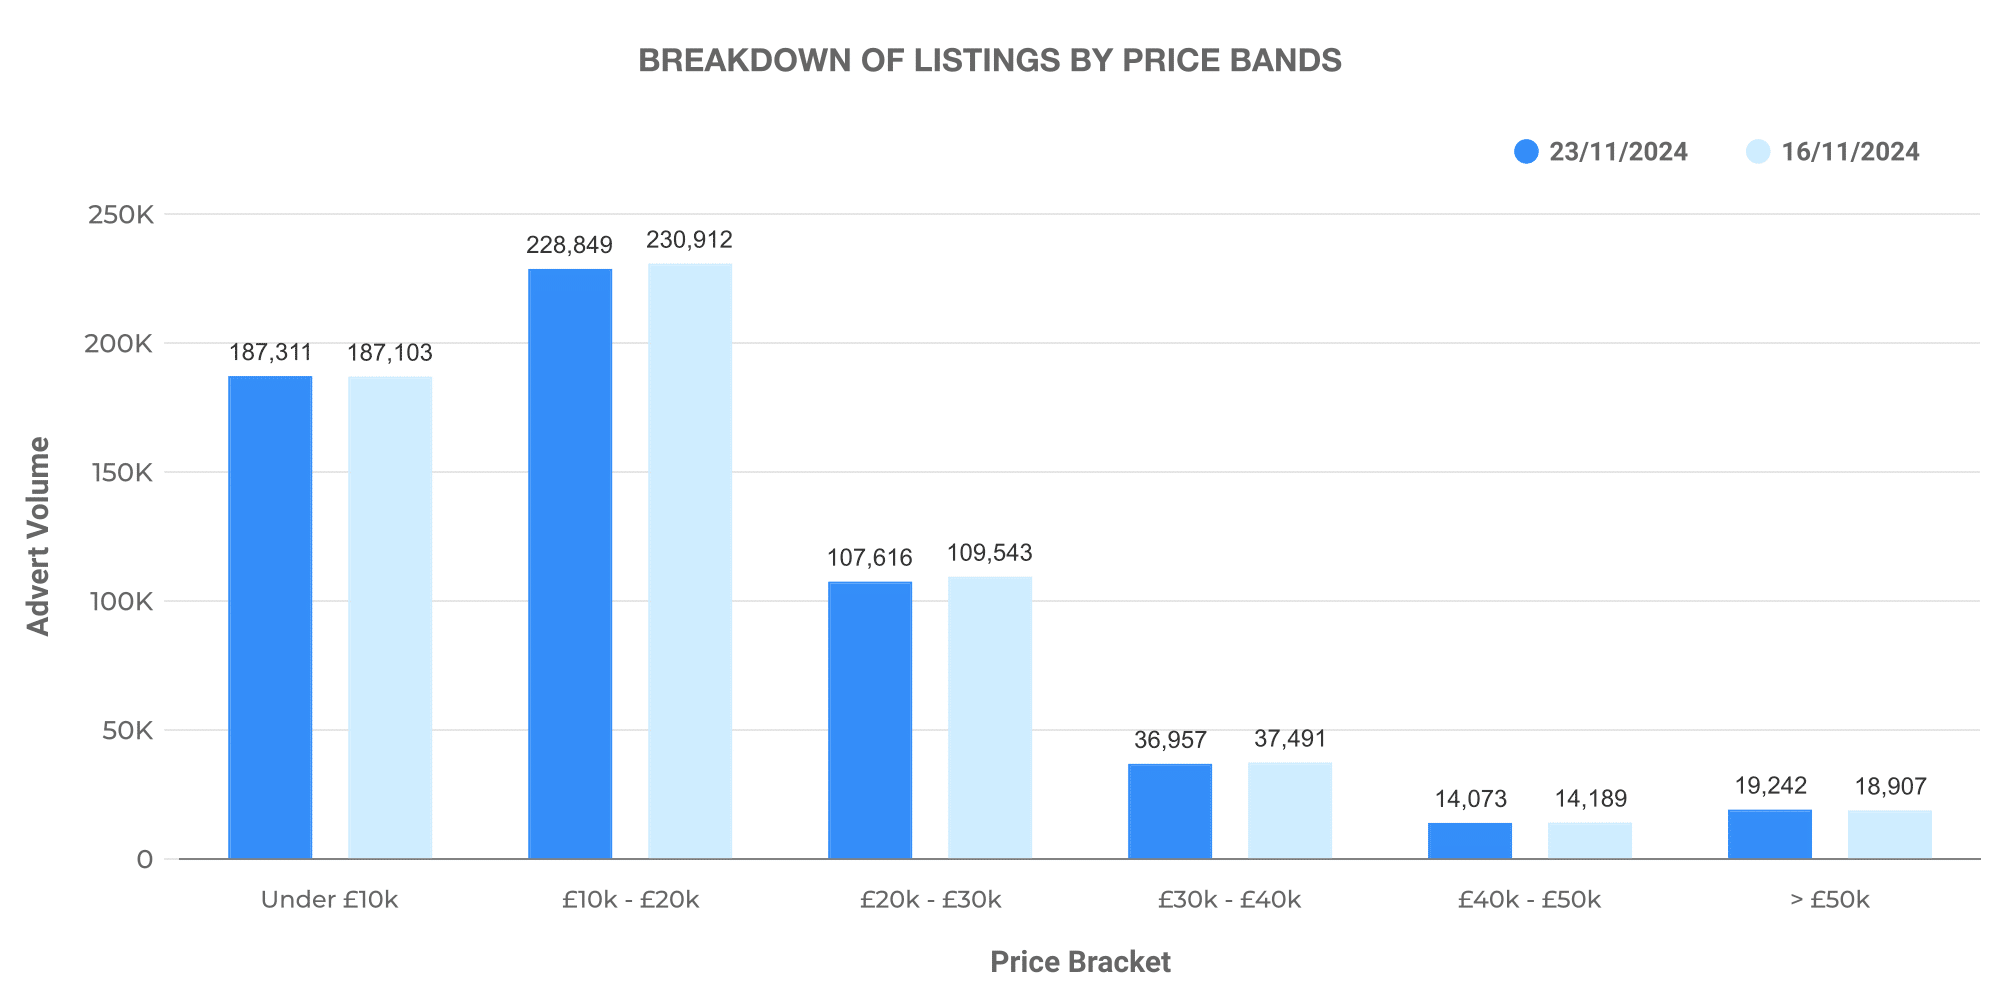
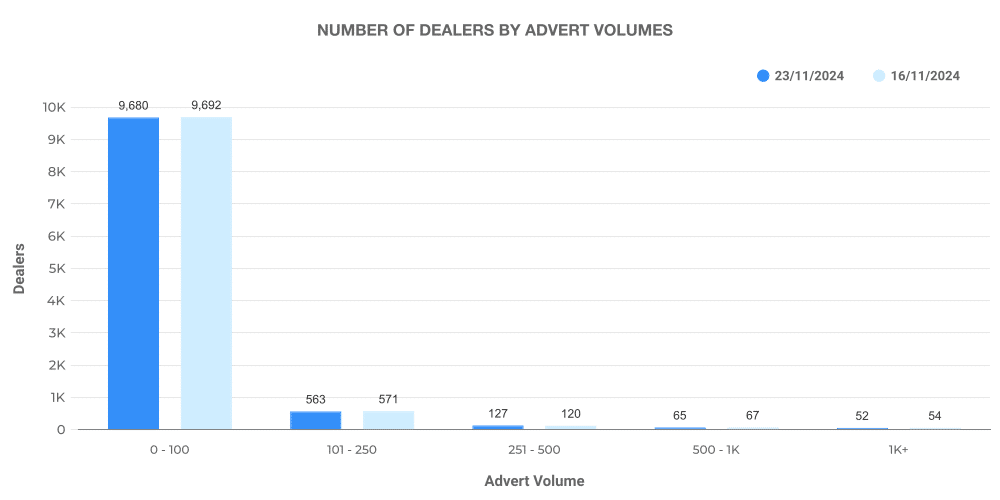
Analysing the graph above, it is clear that ICE vehicle listing volumes were balanced among dealers. Dealers seem to embrace a varied range of capacities catering to different market segments.
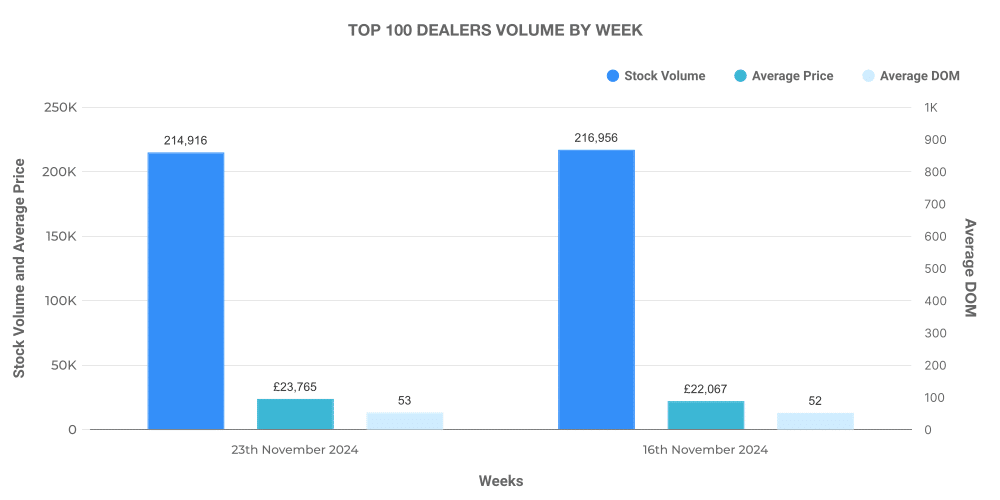
Digging deeper into the data, we find that the top 100 dealers accounted for 35.3% of total listings, with the average price of their listed vehicles slightly higher than the overall market average.
UK Used Car Market: Electric Vehicles (EV)
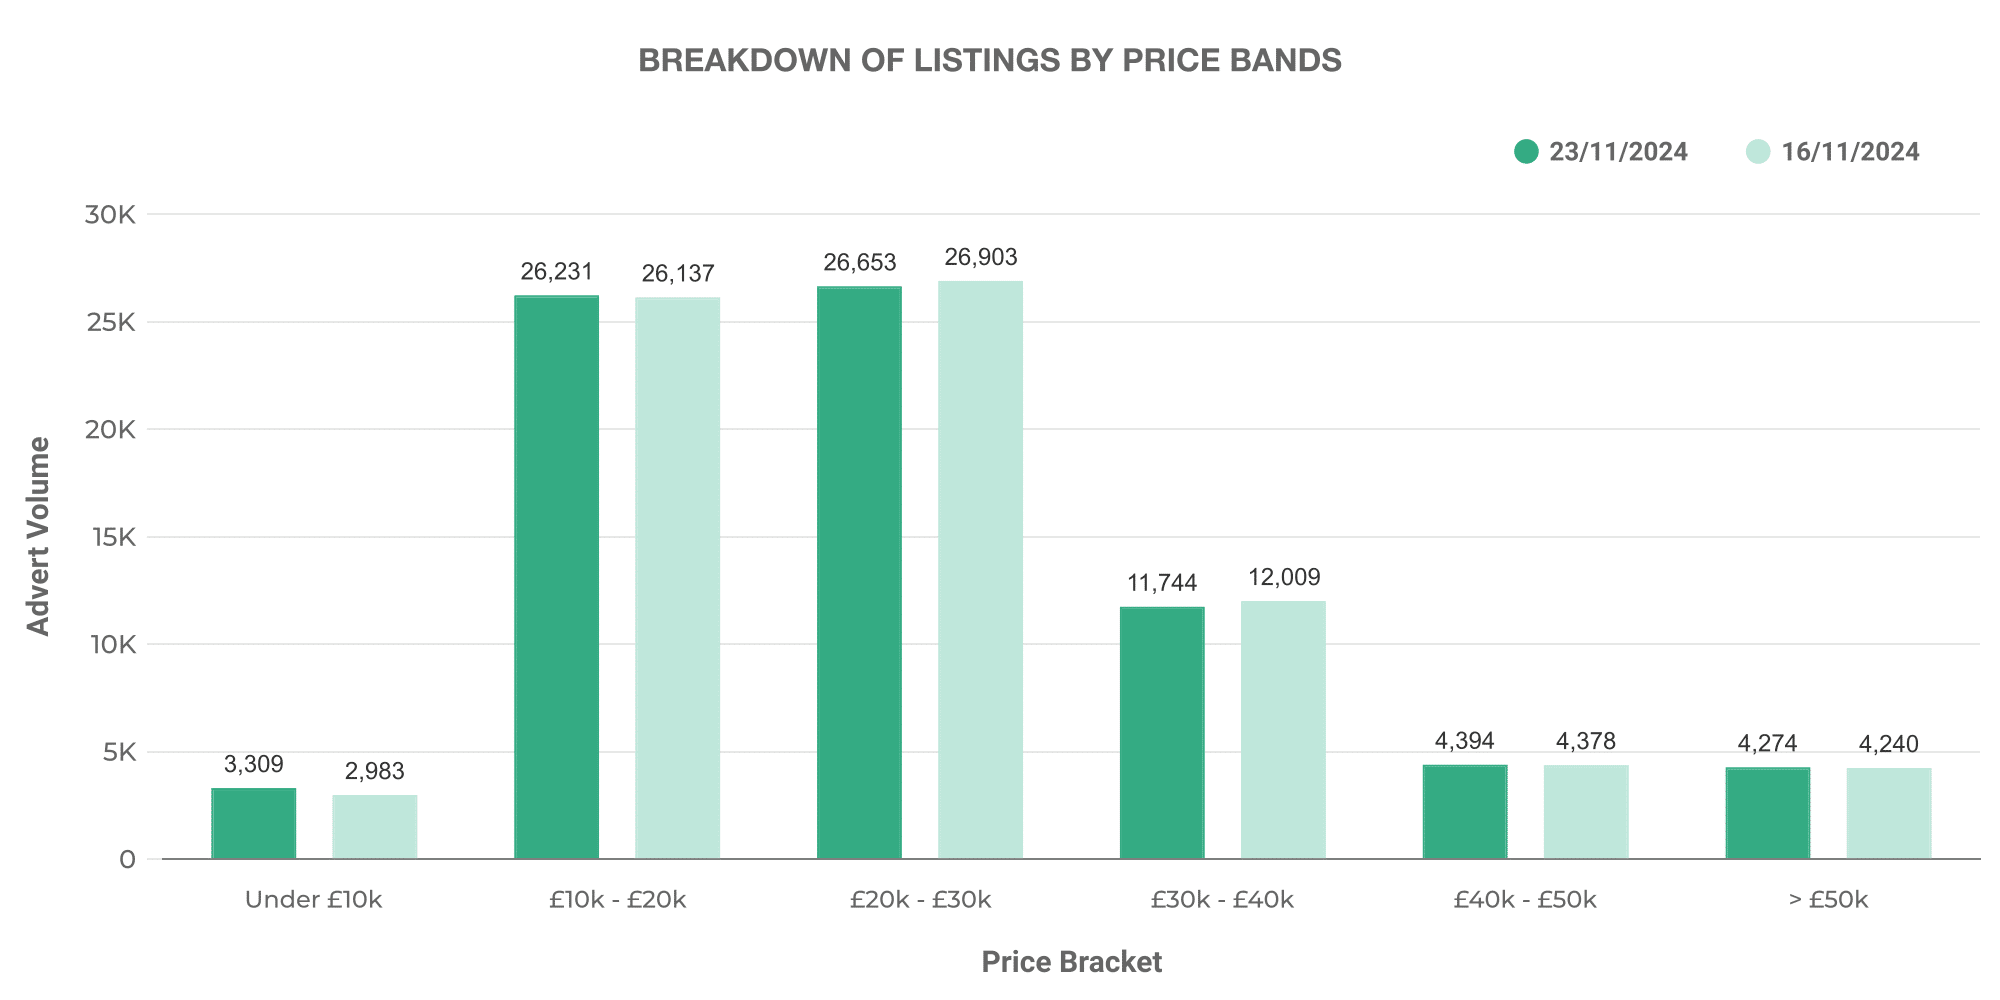
Swinging the lens towards the electric used car market, a total of 77,902 listings were made with an average price of £27,152. EV listings were predominantly in the £10,000 -£20,000 price band, illustrating a potential sweet-spot for aspiring EV owners.
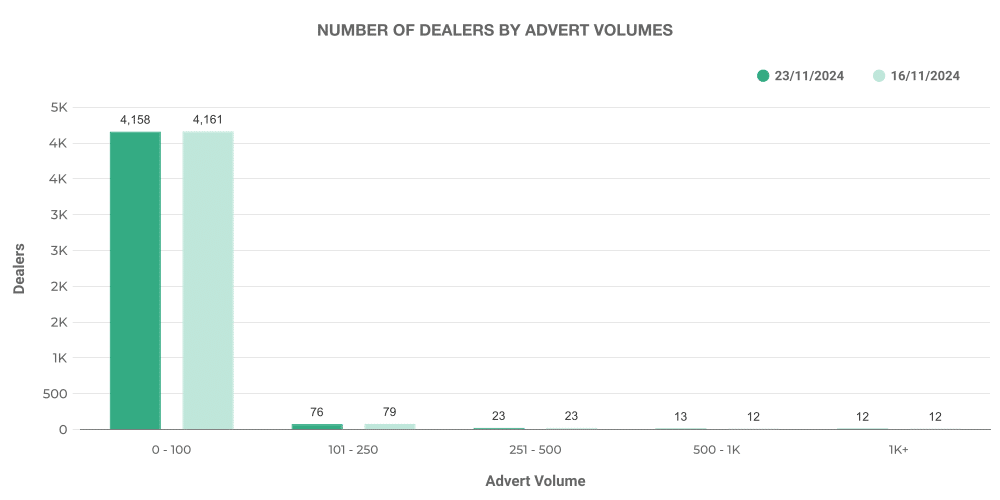
The vast majority of EV dealers listed between 0-100 vehicles, which indicates the burgeoning market conditions for EVs. The relatively small number of vehicles per dealer suggests there is plenty of room for expansion as this market continues to grow.
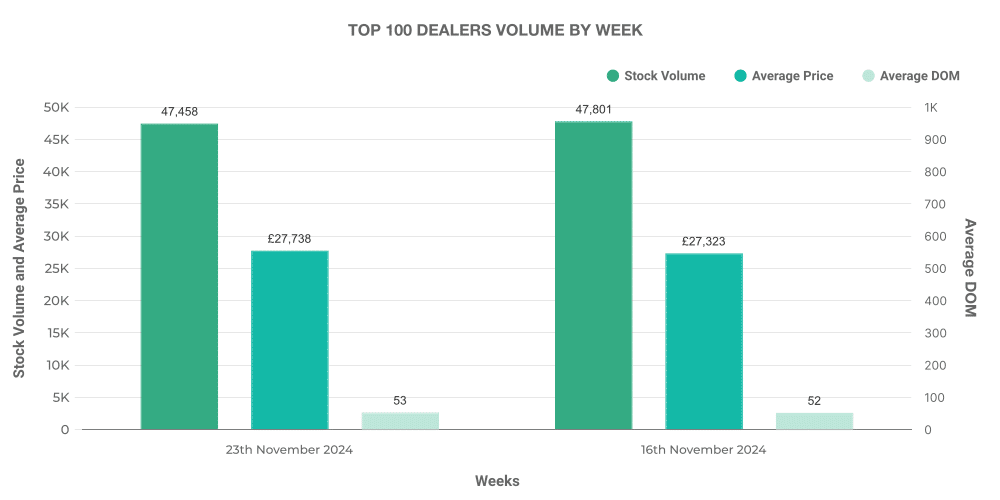
The top 100 dealers accounted for a significant 61% of total EV listings, with their average listed price slightly more than the overall average.
Comparison: ICE vs EV
The percentage share of EVs compared to ICE vehicles offers further insight into the shifting dynamic of the UK used car market. Week 47 saw the percentage of EVs marginally rise to 12.83% of total listings from the previous week’s 12.73%, while ICE cars accounted for the remaining 87.17%.
It’s clear that while consumption patterns display a move towards EVs, ICE vehicles still make up a considerable section of the market. That being said, the rapid development of the EV market signals an intriguing possibility for future automotive trends.
Among the EV offerings, the Toyota Yaris emerged as the most popular model, followed by Toyota C-HR and KIA Niro. By studying these preferences, dealers and other stakeholders will be better able to forecast demand and gear their services accordingly.
Next week: 30th November | Previous week: 16th November
