In the used car market, understanding the changing patterns is critical for any automotive dealer. This examination will focus on the data related to the used car market in the UK and specifically highlight the trends in the electric used car market.
The Current State of the Used Car Market
This week, we observed a total of 611,173 used internal combustion engine (ICE) vehicles listed by 10,705 dealers.
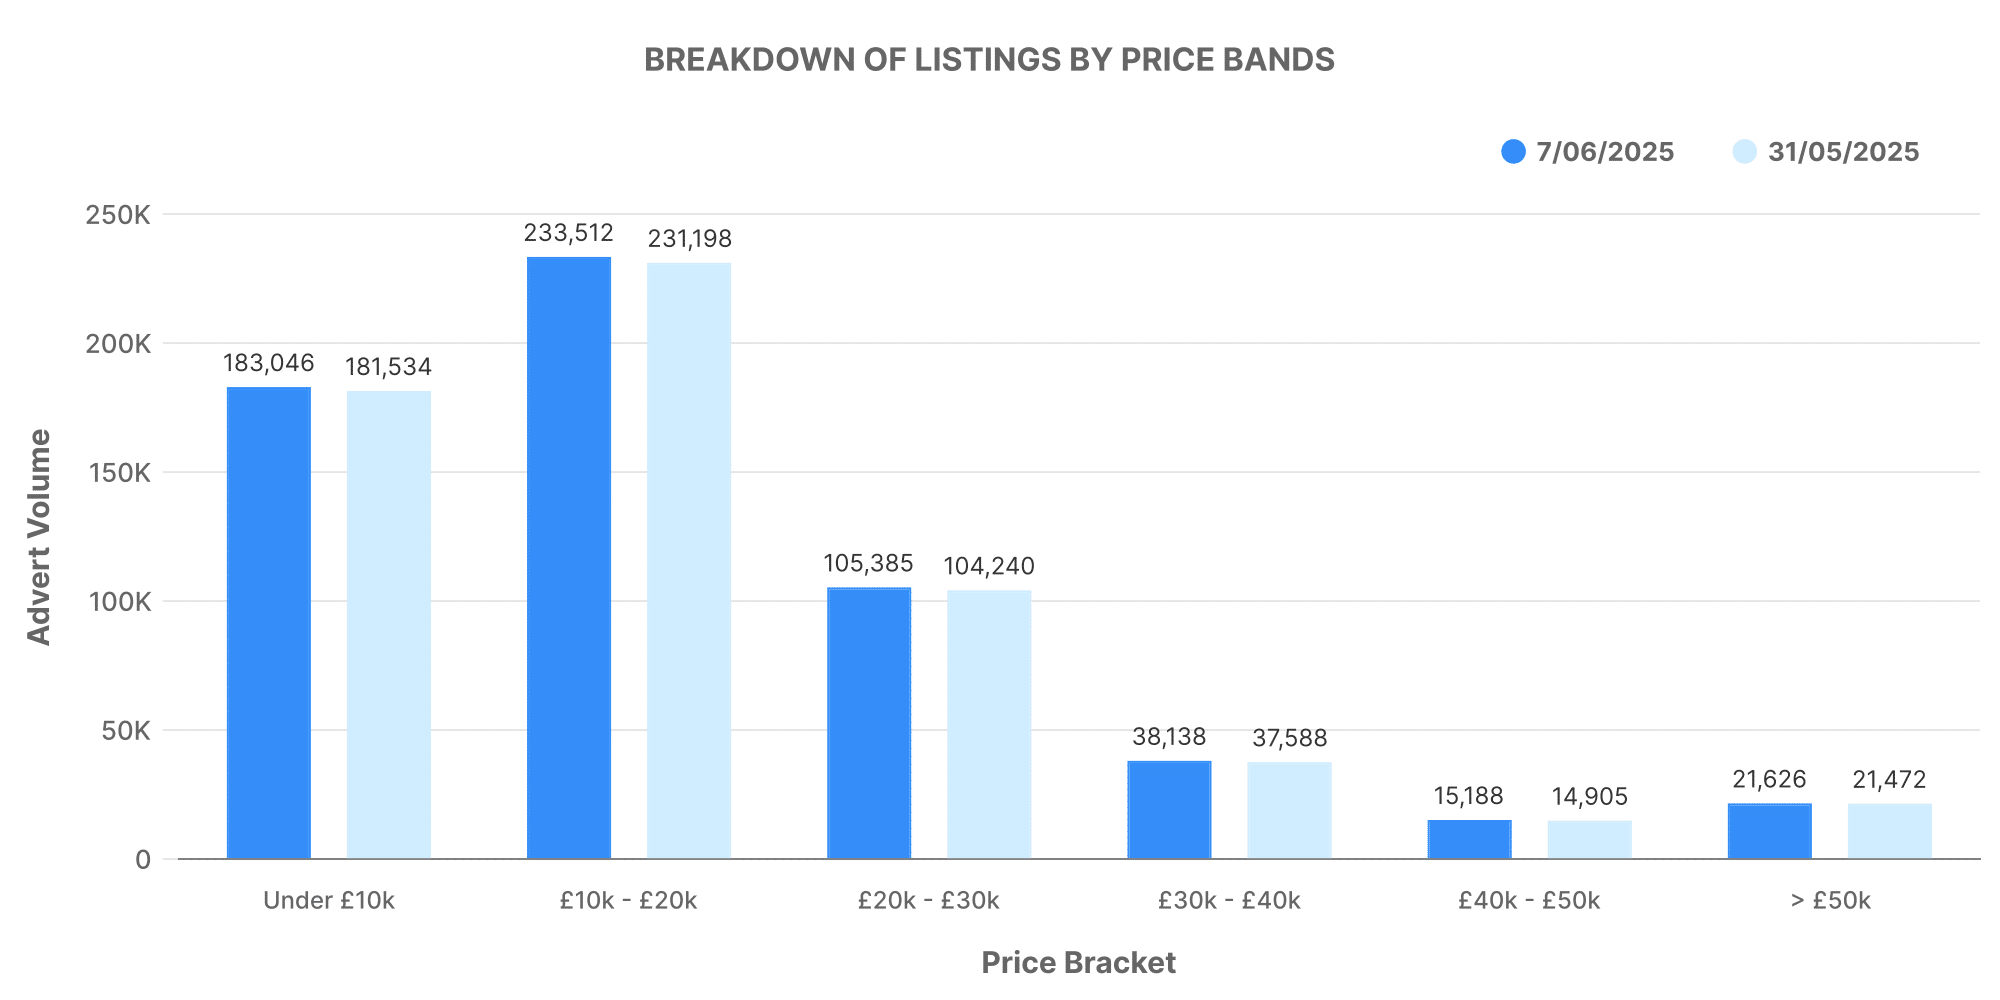
In terms of ICE used car listings by price bands, the significant portion fell within the £10,000 – £20,000 range followed by the £20,000 – £30,000 bracket.
Adding to this, dealership volumes are also critically important in evaluating the market trends.
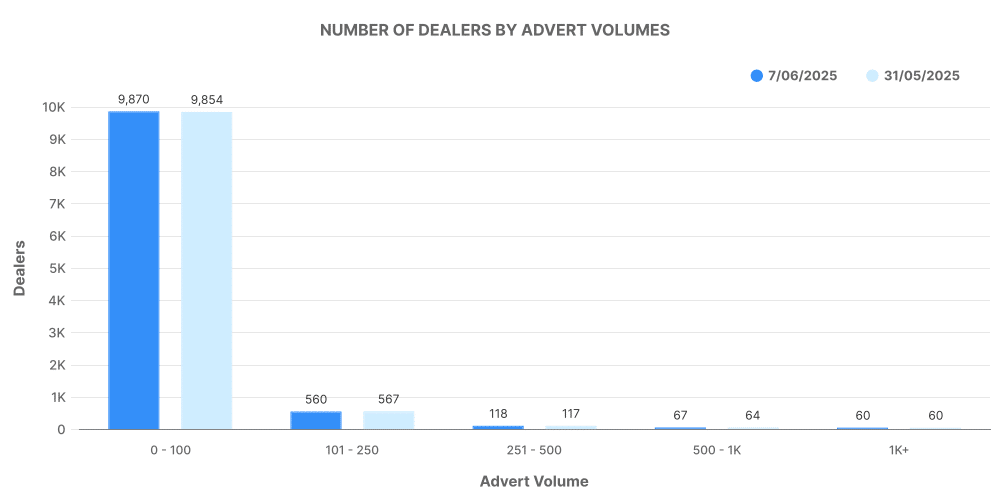
Most dealers listed between 101 to 250 vehicles, indicating an established market with participation from dealerships of varying capacities.
Top 100 Dealers: ICE
The top 100 dealers accounted for a stock volume of 219,022, constituting a notable portion of the total ICE listings.
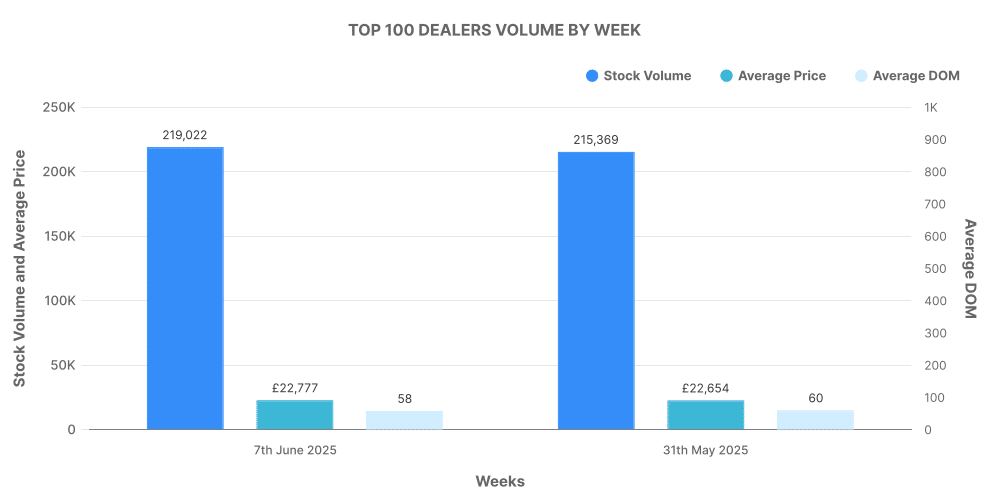
These dealers maintained an average price slightly higher than the market average, indicative of the high-quality vehicles they offer.
The Rise of Electric in the Used Car Market
The weekly data for the used electric vehicle (EV) market demonstrates notable growth and progress. This week, the total number of used EVs listed by dealers was 95,667.
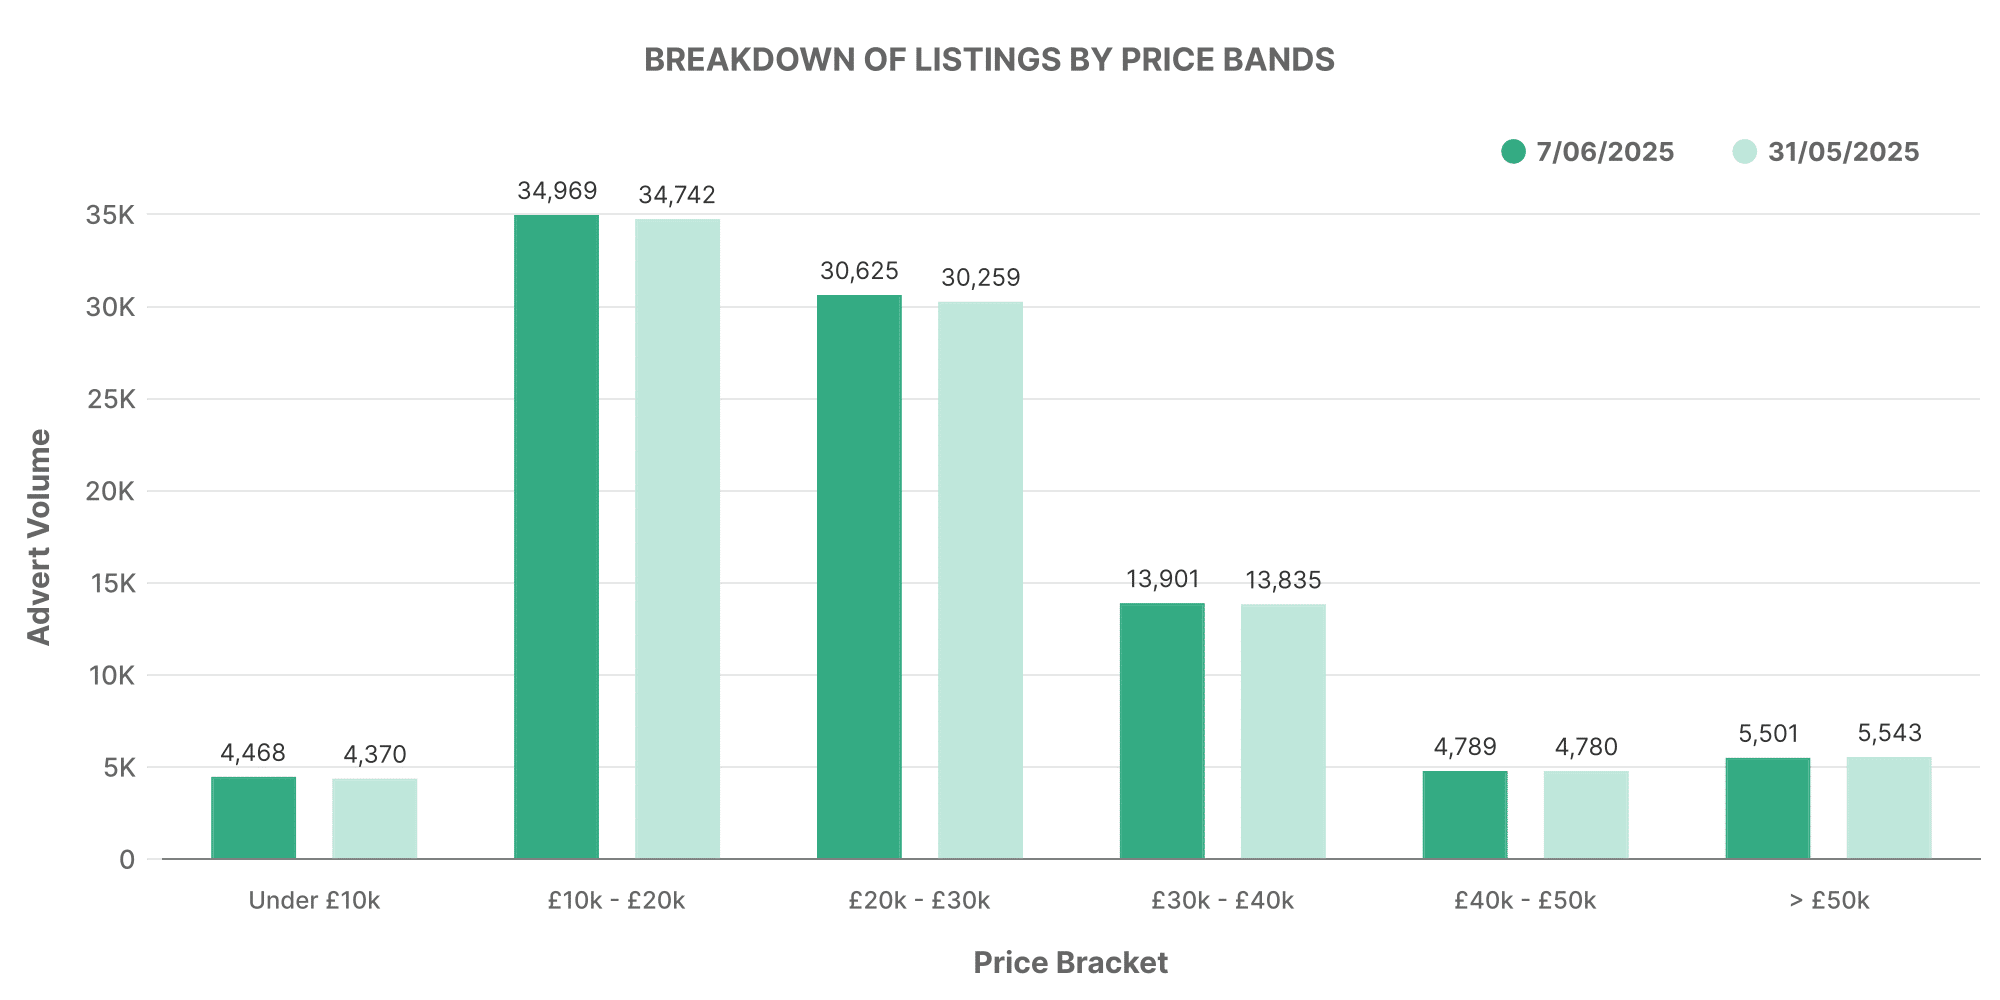
The electric used car listings by price bands mirror the ICE market, with a majority of listed EVs falling within the £10,000 – £20,000, followed by an abundance in the £20,000 – £30,000 range.
Dealer Volume for EVs
Given the growing popularity of EVs, it is important to evaluate dealership listings.
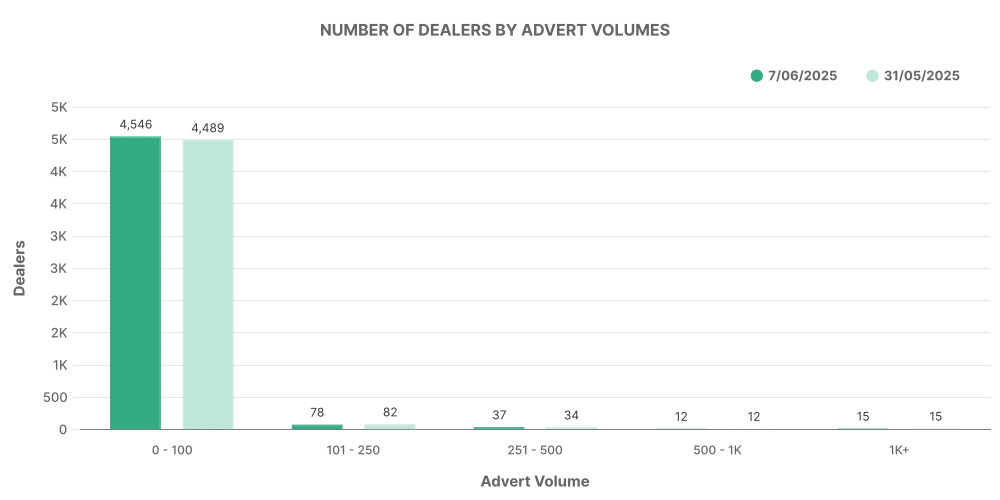
For EVs, the majority of dealers listed between 101 to 250 vehicles, comparable to the ICE market but at lower volumes, indicating the early stages of growth in this sector.
Top 100 Dealers: EVs
When considering the top 100 dealers in the EV market, these dealers accounted for a stock volume of 58,225.
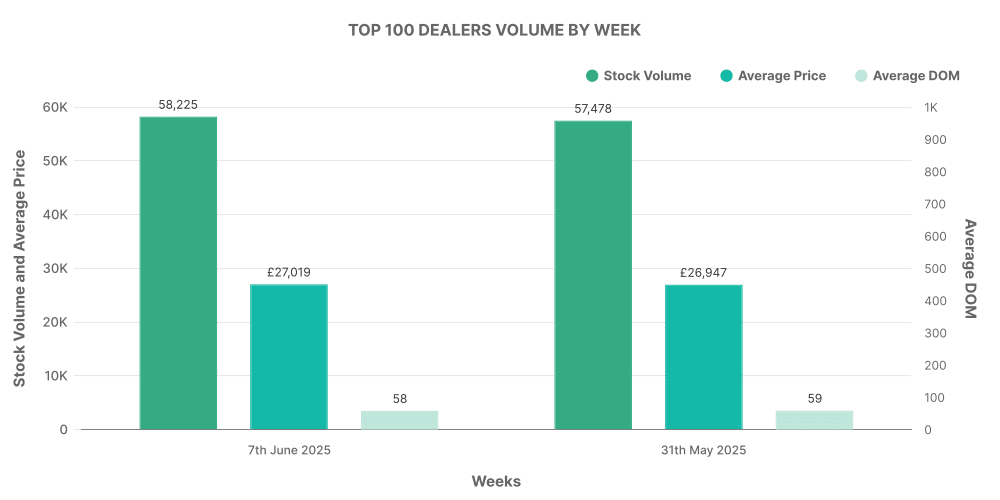
These dealers also maintain an average price slightly higher than the general market average, following a similar trend to their ICE counterparts.
Comparison: ICE vs EV
To round up the analysis, EV market share is at 15.65% of total listings. In terms of pricing, the average price difference between EVs and non-EVs has been reducing week-on-week. This week the average prices are £26,321 for EVs and £18,682 for ICE vehicles.
