Navigating through the ever-evolving dynamics of the used car market is a strategic necessity for all automotive dealers. Close examination of these trends is essential to sharpen their strategies as well as forecast future growth. Here, we take you through the data trends related to both the Internal Combustion Engine (ICE) and Electric Vehicles (EV) in the UK used car market to give you those essential automotive market insights.
Internal Combustion Engine Vehicles: A Closer Look
In the first week of July, data indicate a slight decline in the total number of dealerships dealing in used ICE vehicles to 10,645, compared to the previous week’s 10,699. The listings show a tiny uptick to 611,617, a positive change from the former’s 607,170. Similarly, the average price pushed marginally upwards from £18,620 to £18,721.
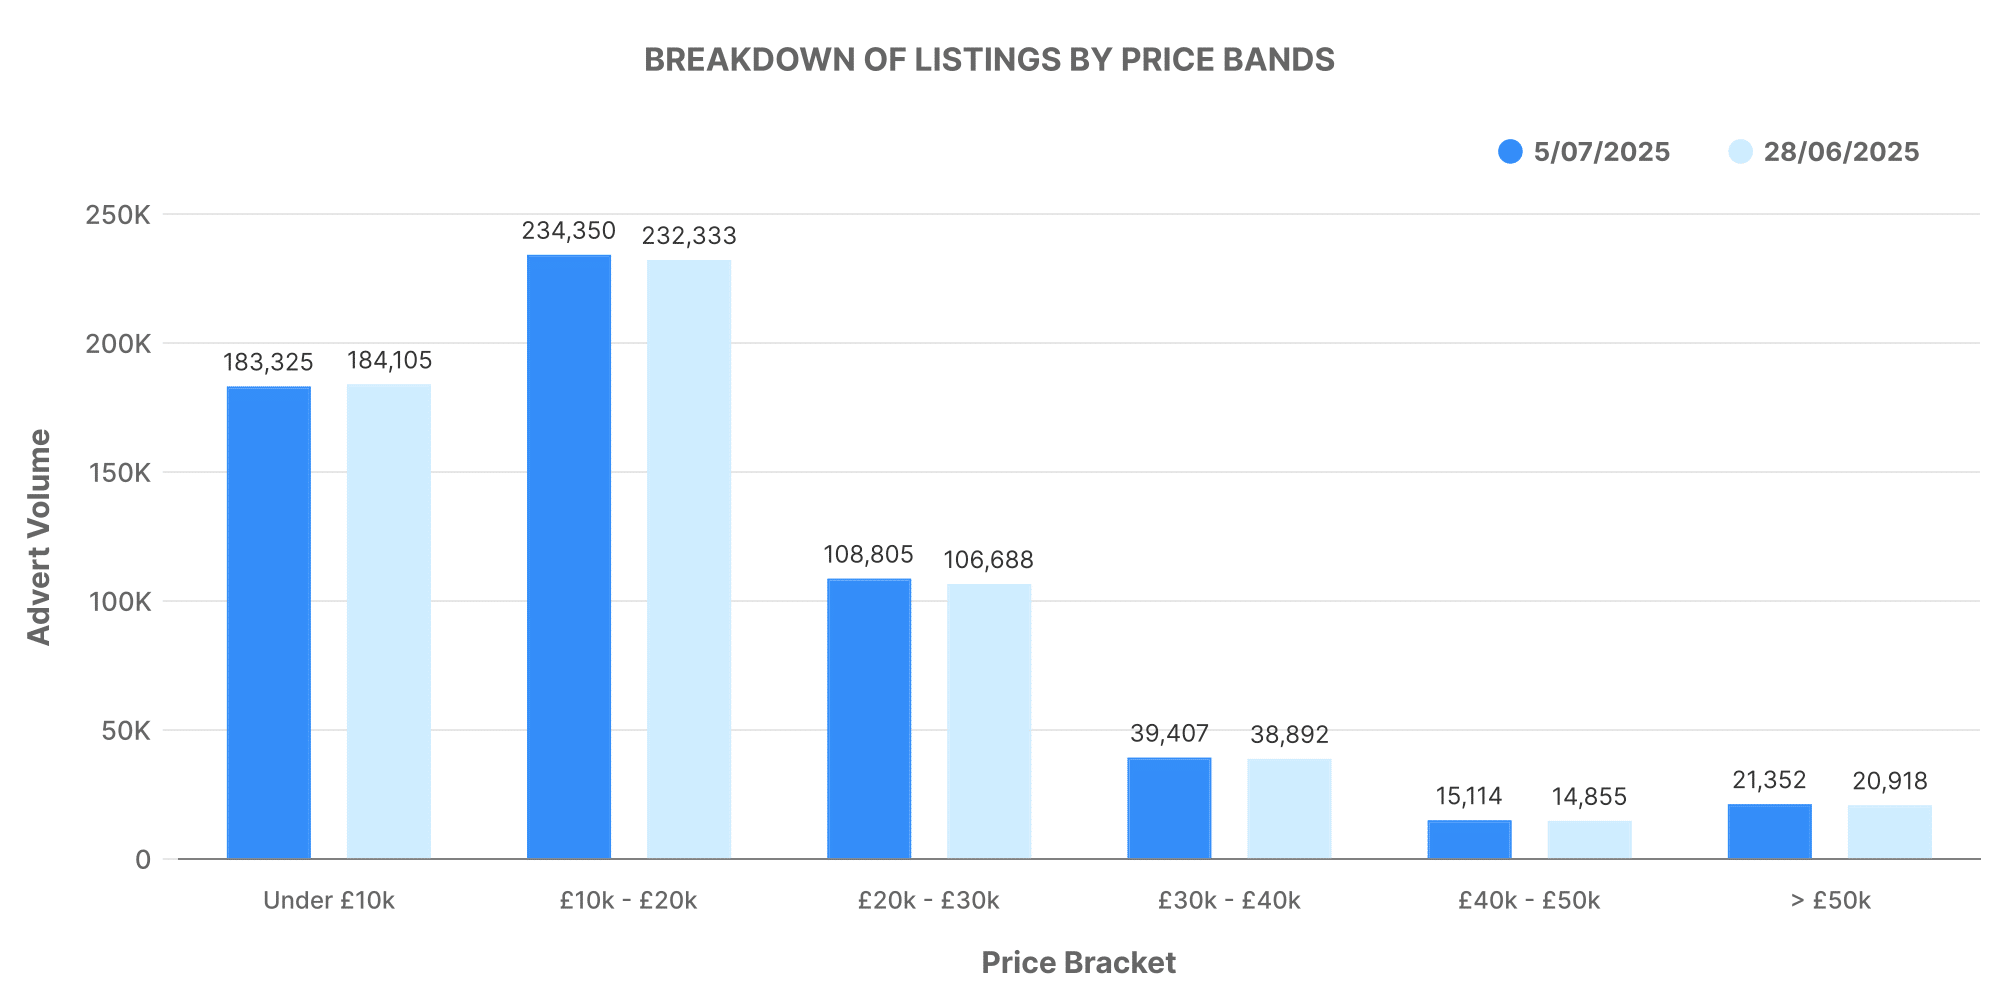
The most populous price band for ICE cars continued to be the £10,000 – £20,000 range, followed by the £20,000 – £30,000 bracket. Despite the trend being consistent, slight shifts in volumes were present. A more detailed breakdown via graphs, for our better understanding.
Electric Vehicles (EV): A Constant Rise
The electric used car market also showcased a marginal fluctuation in dealer number, slightly growing from 4,784 to 4,788. Dealer rooftops and total electric vehicle listings saw a respective growth to 8,353 and 95,950. Consistent with the prior week, the average price for used EVs reposed slightly greater at £26,359 compared to the last week’s £26,283.
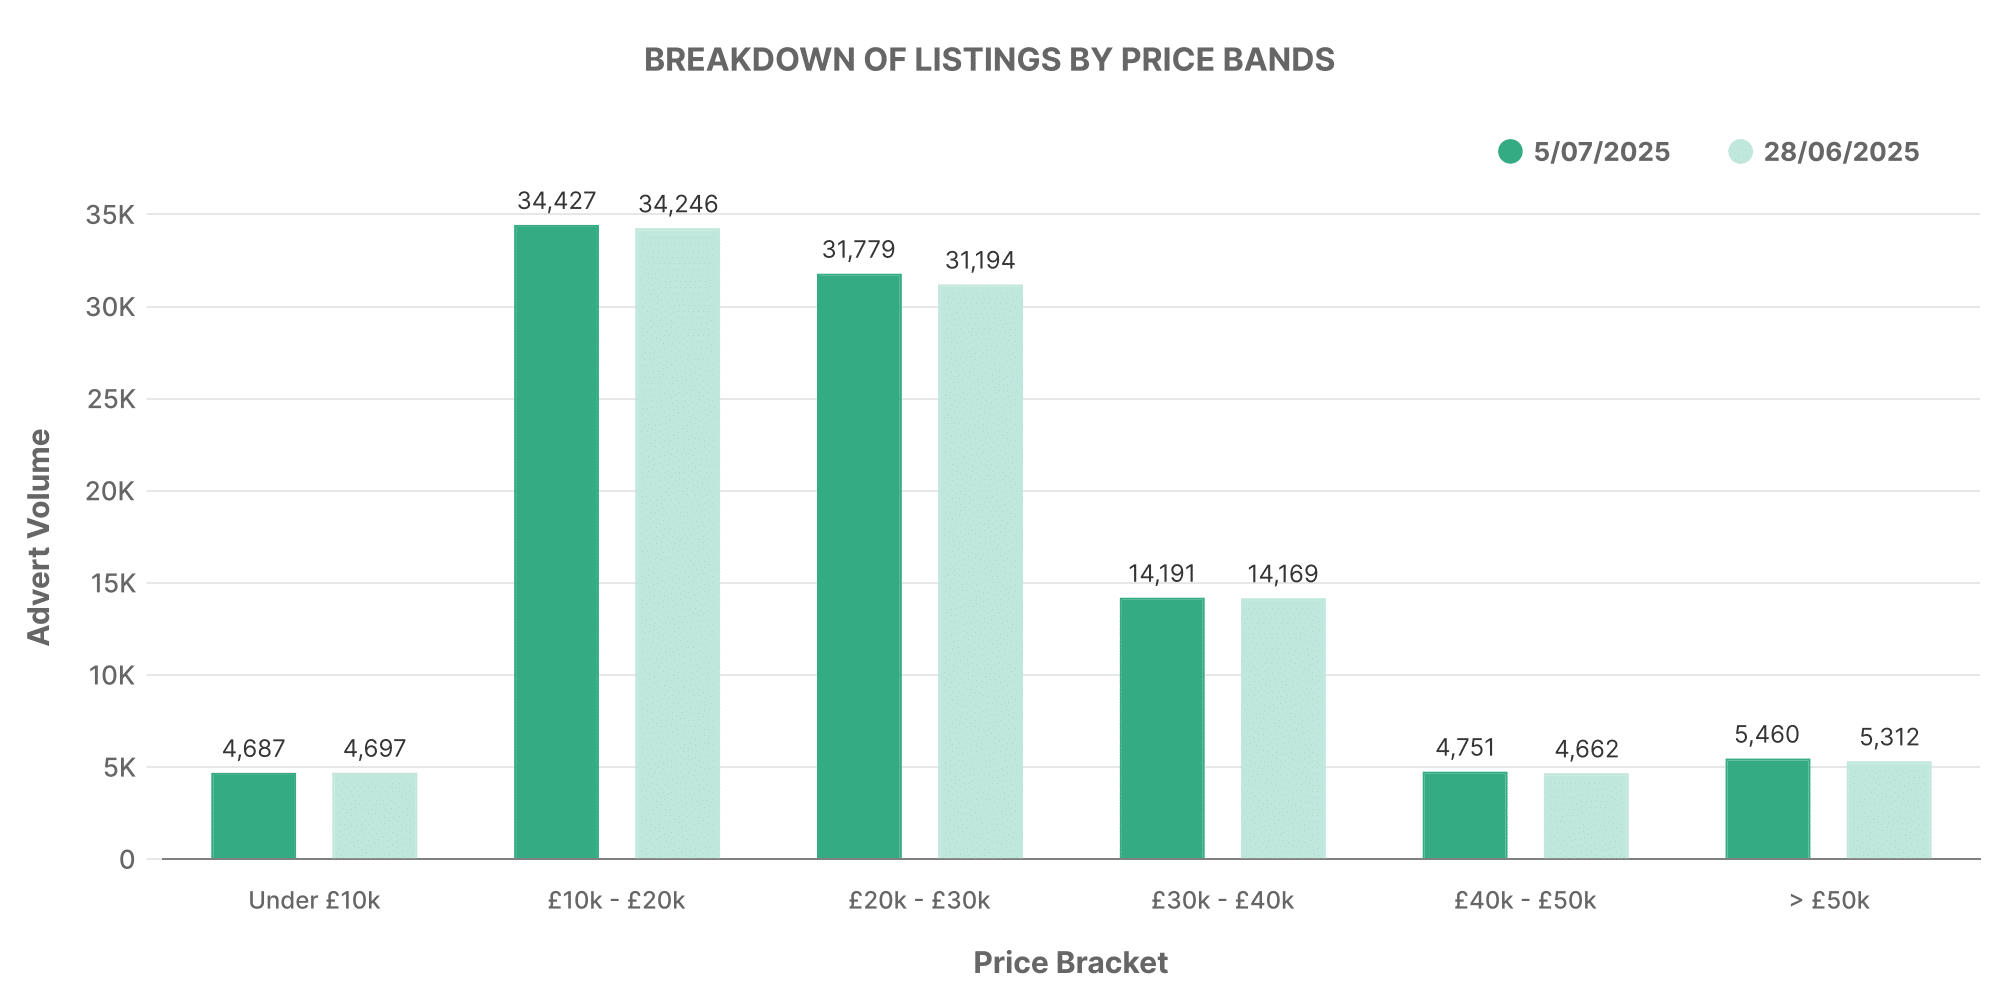
Moreover, the data for EV price bands highlighted a somewhat parallel patterning to the ICE vehicles, with most EVs falling within the £10,000 – £20,000 mark.
Dealer Volume Analysis
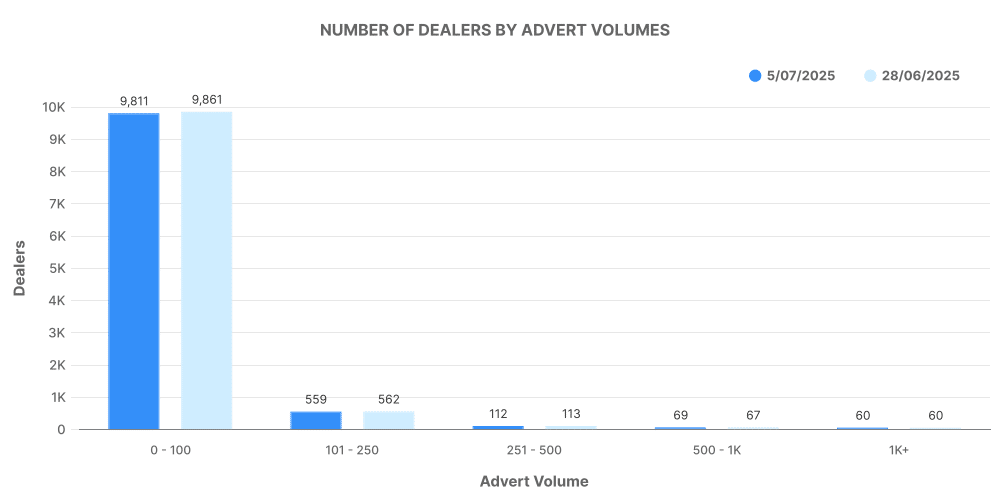
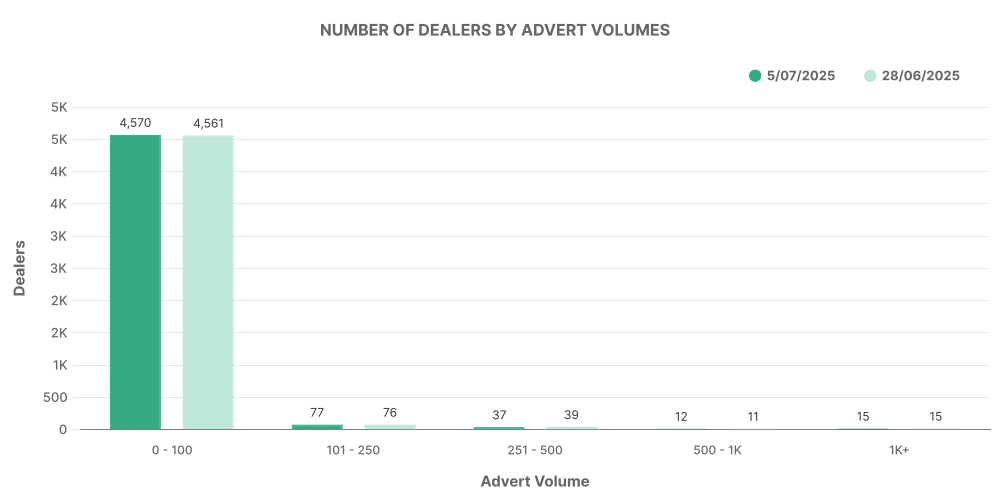
Diving further into evaluating dealership volumes adds tint to our analysis and depicts an exciting contrast between conventional ICE and the burgeoning EV market.
Investigating ICE vehicle numbers, we see that most dealerships recorded between 0-100 vehicles. However, for the blossoming EV market, the volume swings largely towards the 0-100 vehicles per dealer bracket, indicating a still emerging, yet promising market space waiting for fulfilment.
Top 100 Dealers: ICE vs EV
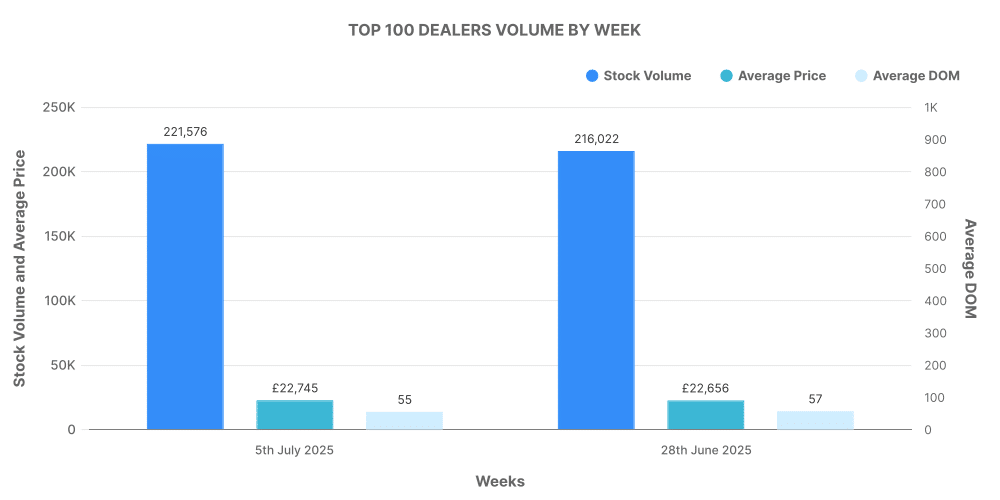
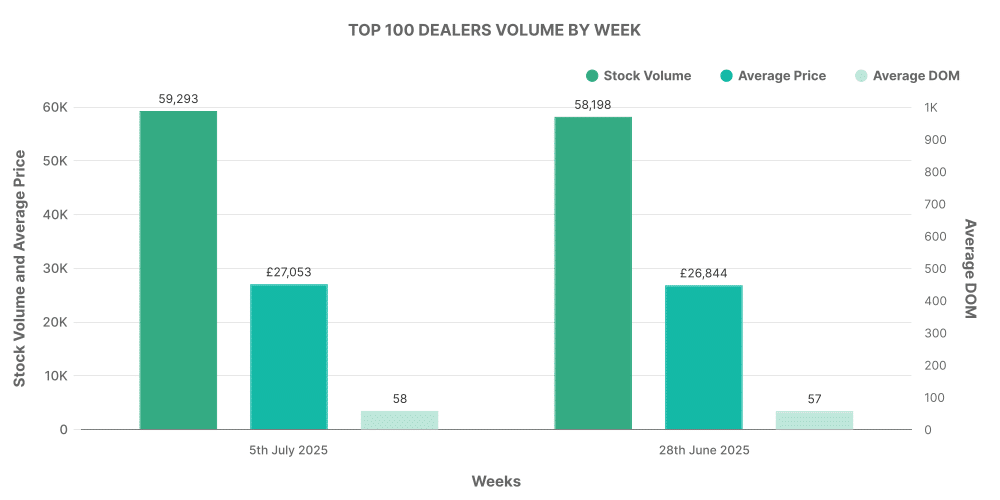
An intriguing comparison draws attention to the performance of the top 100 dealerships in both the EV and ICE vehicle markets. For EVs, these prime dealers held 20.1% of total EV listings, while their ICE counterparts accounted for a slightly more considerable 22.3% of total listings.
