UK Weekly Used Car Market Data – 1st March 2025
Analysing the shifts and trajectories in the used car market is paramount for stakeholders within the automotive industry. A keen focus on these trends can enable car dealers to refine their strategies and set ambitious growth goals. This report examines data from the UK’s used car market, holistically embracing both traditional combustion engine vehicles (ICE) and the increasingly relevant electric used car sector (EV).
The Used Car Market: Combustion Engine Vehicles (ICE)
For the week ending 1st March 2025, the ICE market data reveals a total of 574,288 listed used cars within the UK. These listings were represented by 10,460 dealerships.
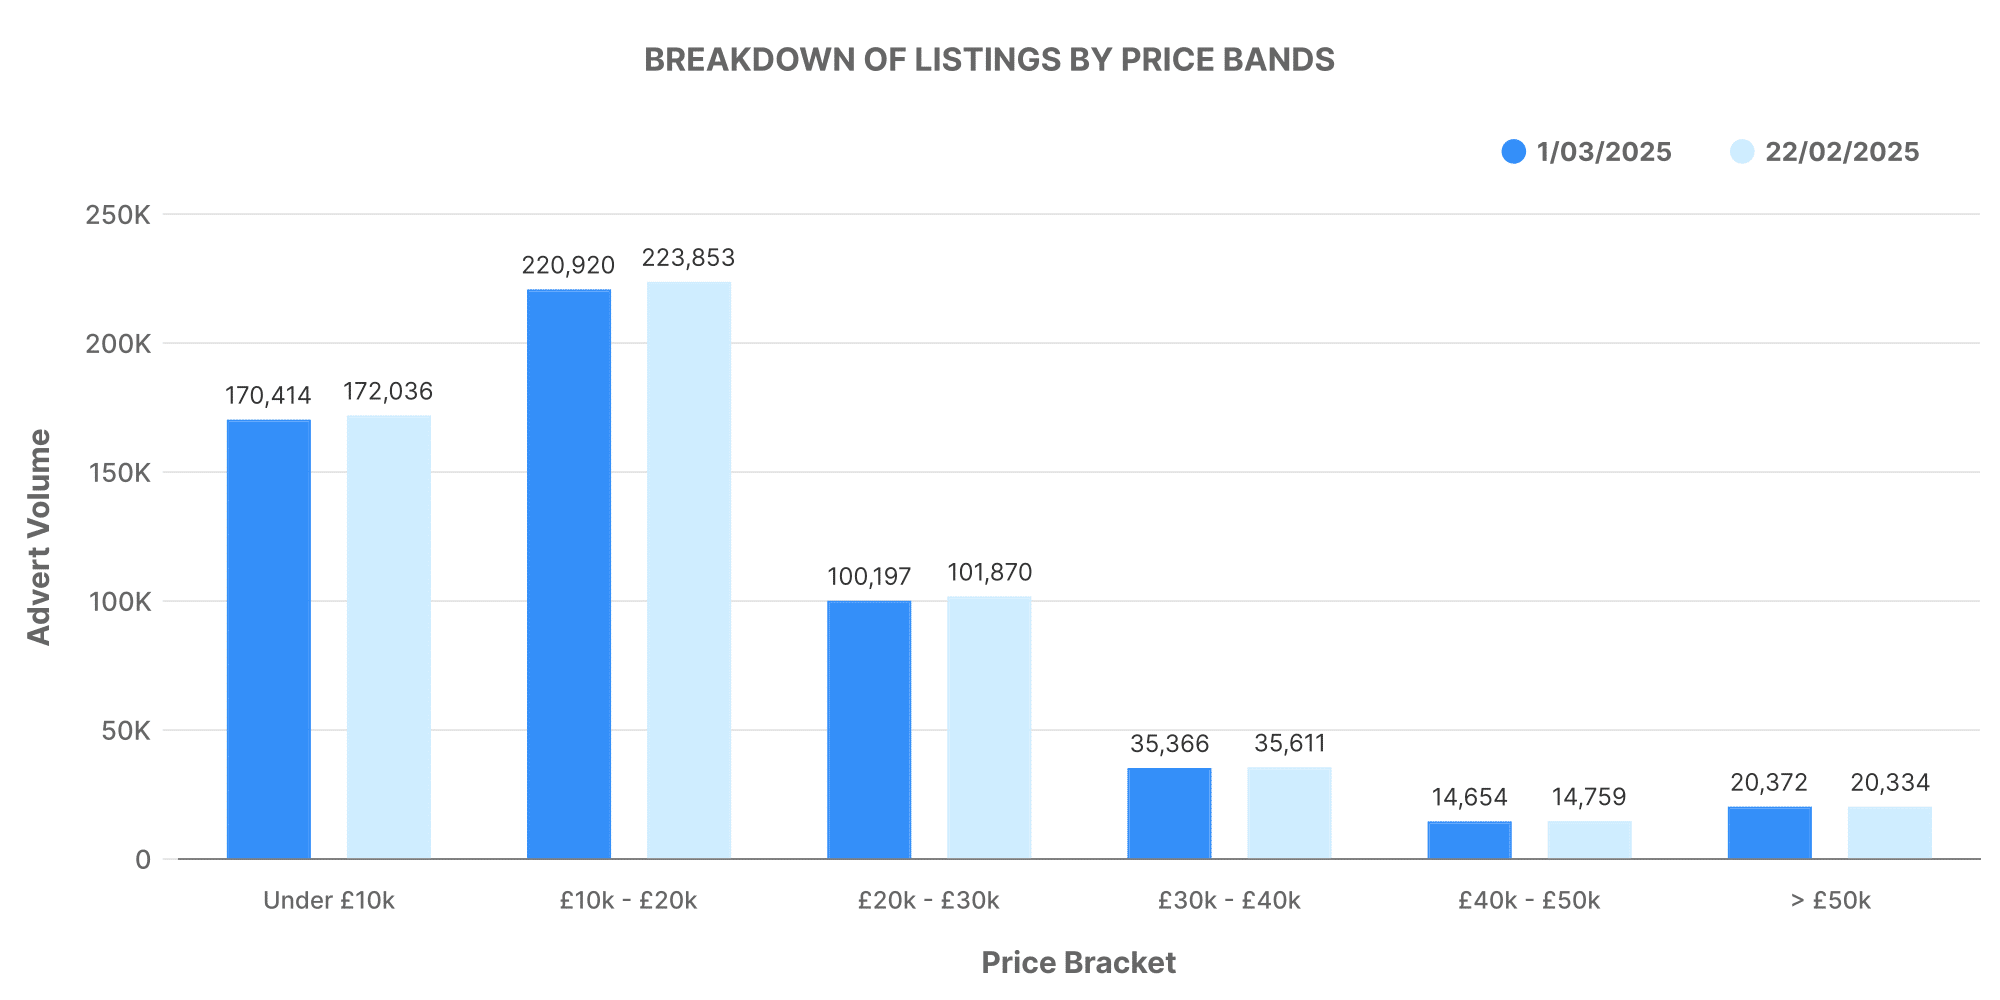
The majority of listed ICE vehicles fell within the £10,000 – £20,000 bracket, as indicated by the graph above, with a considerable volume within the £20,000 – £30,000 range. Notably, the average price of listed ICE cars for this week was around £18,752.
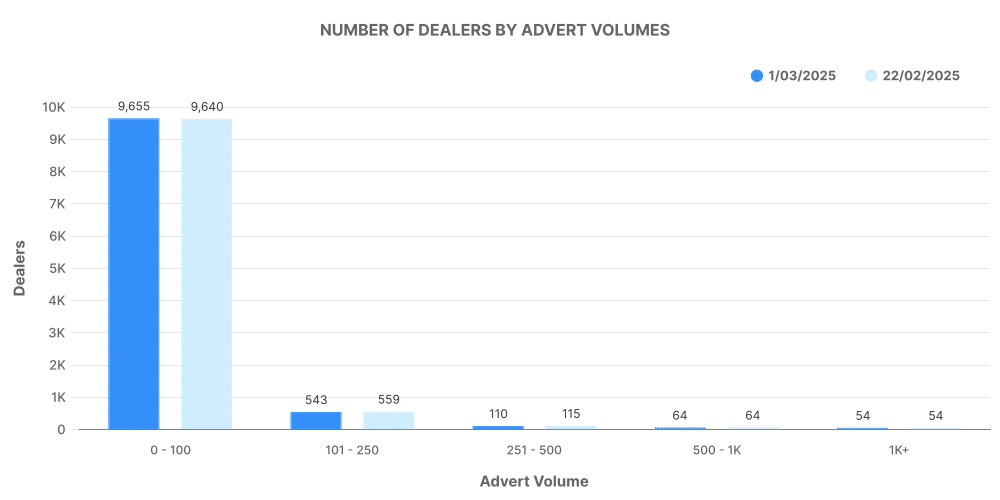
Analysing the distribution of vehicles in ICE dealer inventories, the graph shows the vast majority have between 0-100 vehicles. This reflects the varied size and capacity of dealerships within the UK’s robust used car market.
Top 100 Dealers: ICE Market
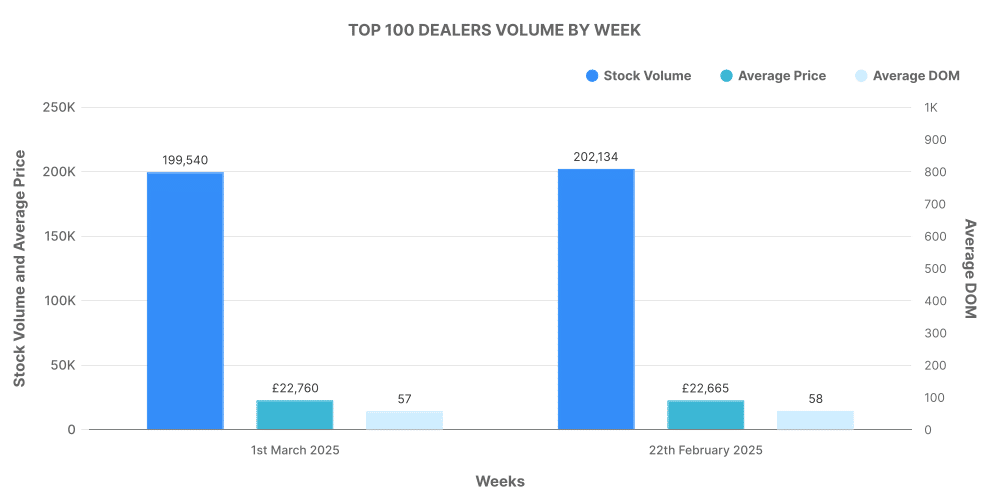
The graph presents the performative breakdown of the top 100 dealers by volume for the ICE market. These dealers accounted for 34.7% of total listings, selling vehicles with a higher than average market price.
The Electric Used Car Market (EV)
The number of used electric vehicles (EV) listed for the same period was notably smaller, a total of 88,812 listed by 4,559 dealers.
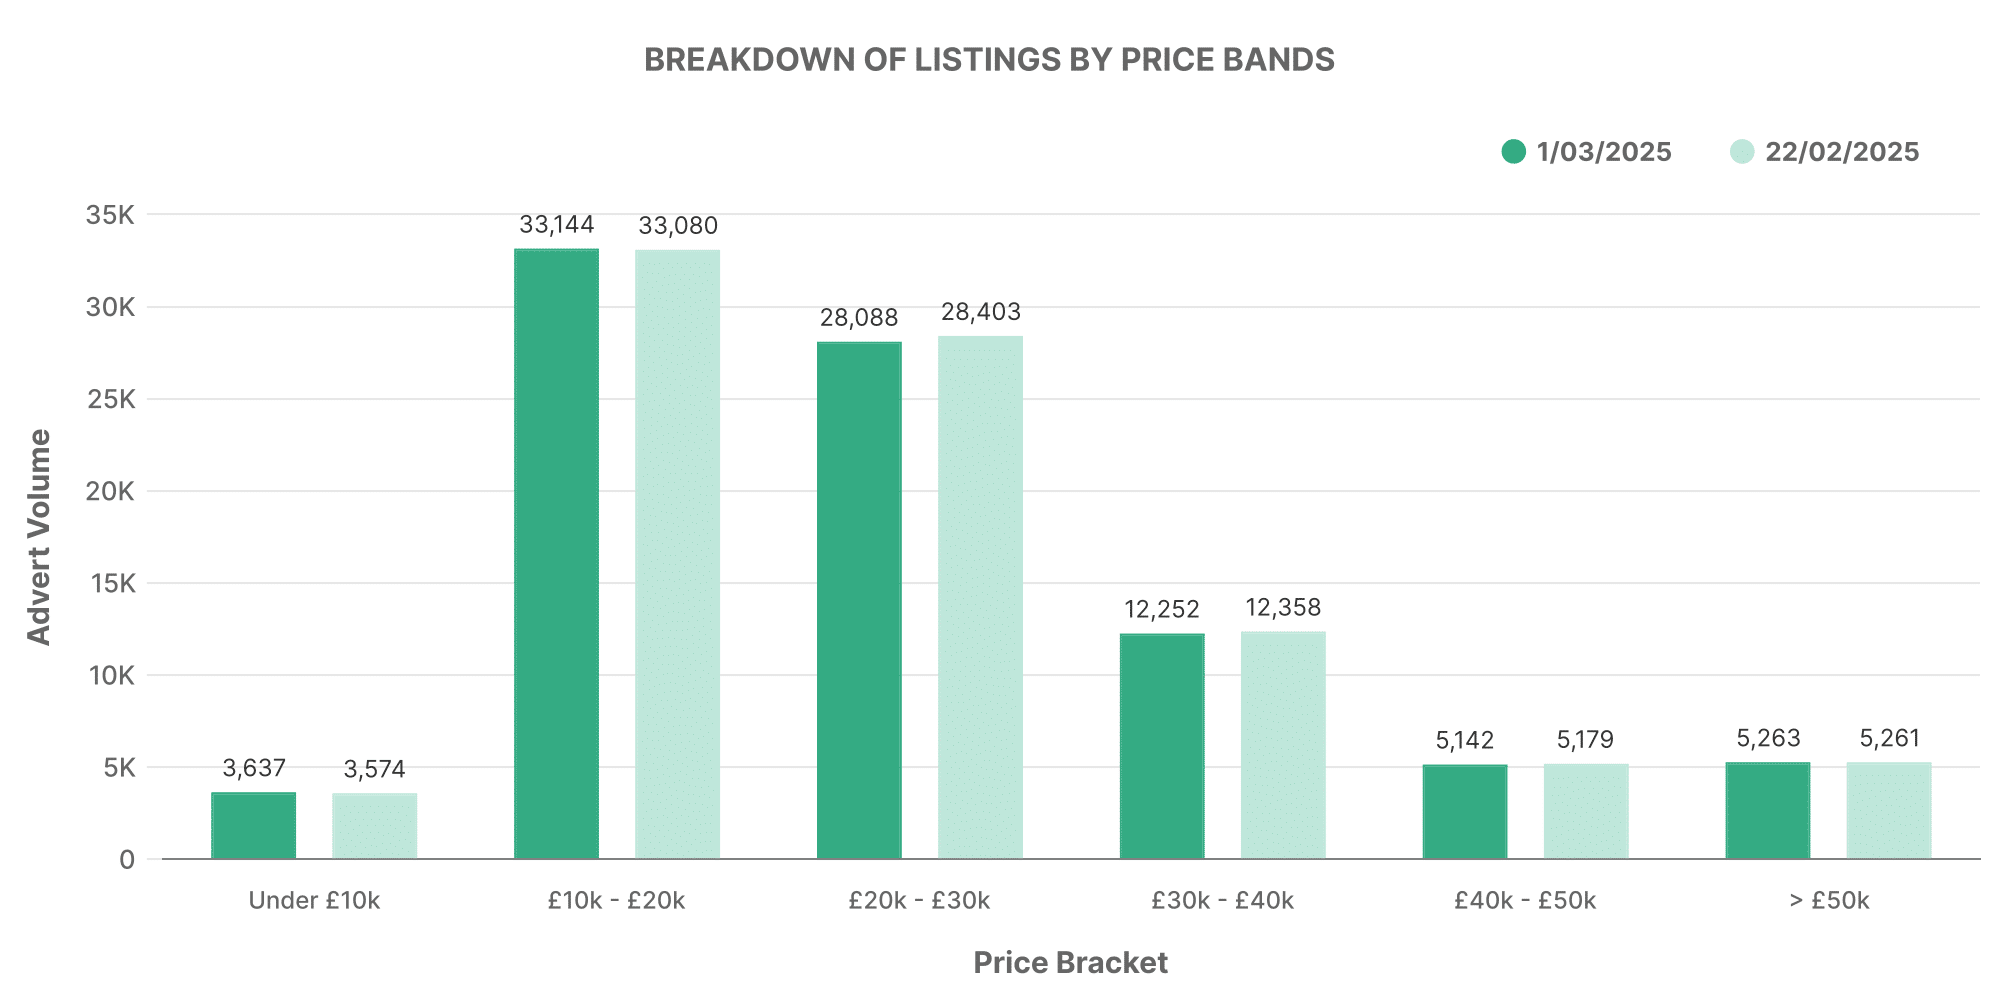
Price breakdown for the EV sector reveals that the bulk of electric vehicles are listed within the £10,000 – £20,000 range. With an increasing number falling within the £20,000 – £30,000 band, the average market price for EVs was substantially higher than ICE vehicles at roughly £26,569.
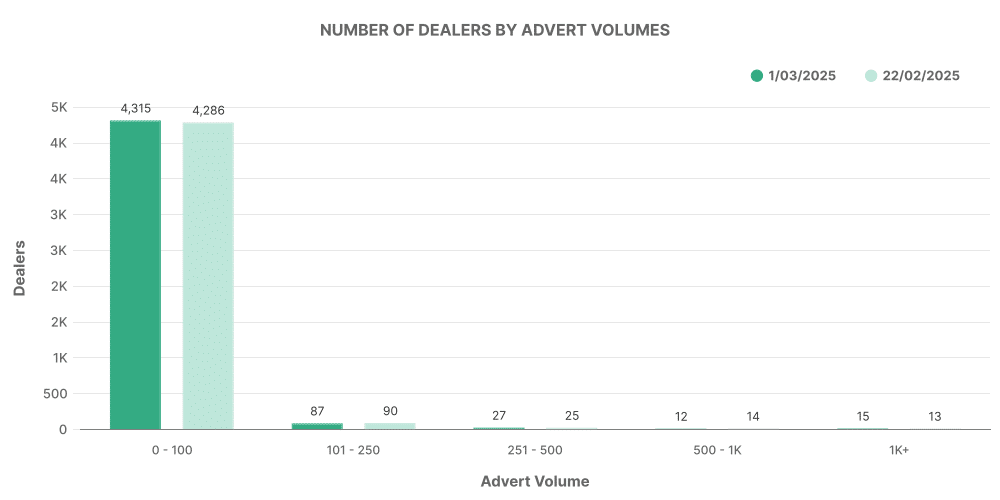
On the topic of inventory distribution, EV dealerships showcase a similar trend to their ICE counterparts. A large number of EV dealerships hold an inventory of between 0-100 vehicles, indicative of the budding state of the EV market in the UK.
Top 100 Dealers: EV Market
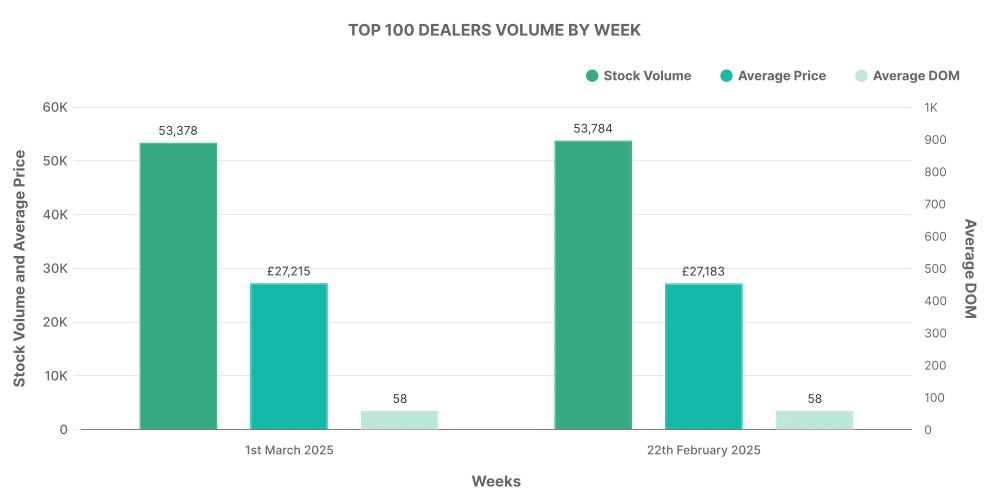
As per the data, the top 100 EV dealers accounted for 16.7% of the total EV listings in the UK. Much like the ICE market, vehicles sold by these dealers also displayed slightly higher than average market prices.
Comparing ICE and EV: Overview
Whilst the ICE market continues to lead in terms of sheer volume, the EV market’s steady rise is undeniable. The EV market now accounts for a 15.46% share of the total UK used car market, with a slightly higher average price compared to ICE cars.
Furthermore, the lead in total listings by the top 100 dealers in the ICE market over their EV counterparts suggests a slight concentration of power within the ICE market. However, it is evident that the proliferation of EV is fostering opportunities for growth and diversification in the UK’s automotive industry.
To truly capitalise on the emerging trends within the used car market, a critical understanding of market data, such as that provided by Marketcheck UK, can optimise decision making for businesses within the automotive sector including car dealers, insurers, investors, and other stakeholders. Such a data-driven approach can facilitate effective strategising, opening avenues for sustained growth, and long-term success.
Next week: 8th March | Previous week: 22nd February
