UK Weekly Used Car Market Data – 22nd February 2025
Understanding trends in the UK’s used car market – specifically the rise of the electric vehicle – is fundamental to automotive dealerships, insurance groups, investors, auctioneers and finance brokers. In our weekly review, we analyse the UK used car market data; focusing on Internal Combustion Engine vehicles (ICE) and the burgeoning Electric Vehicle niche (EV). Incorporating data from 22nd February 2025, we deliver comprehensive insights into the automotive market.
Examining trends and decisive shifts can significantly aid groups in fine-tuning strategies and preparing for future expansions. Our comprehensive weekly analysis will provide you with essential transparency on the crucial metrics defining the landscape of the UK’s used car market.
The Prevailing Influence of ICE in the Used Car Market
Despite the environmental and financial gains of electric vehicles, combustion engine vehicles retain their appeal within the UK’s used car market. For the week concluding the 22nd February, ICE cars numbered a staggeringly high 580,980 listings across 10,466 dealers.
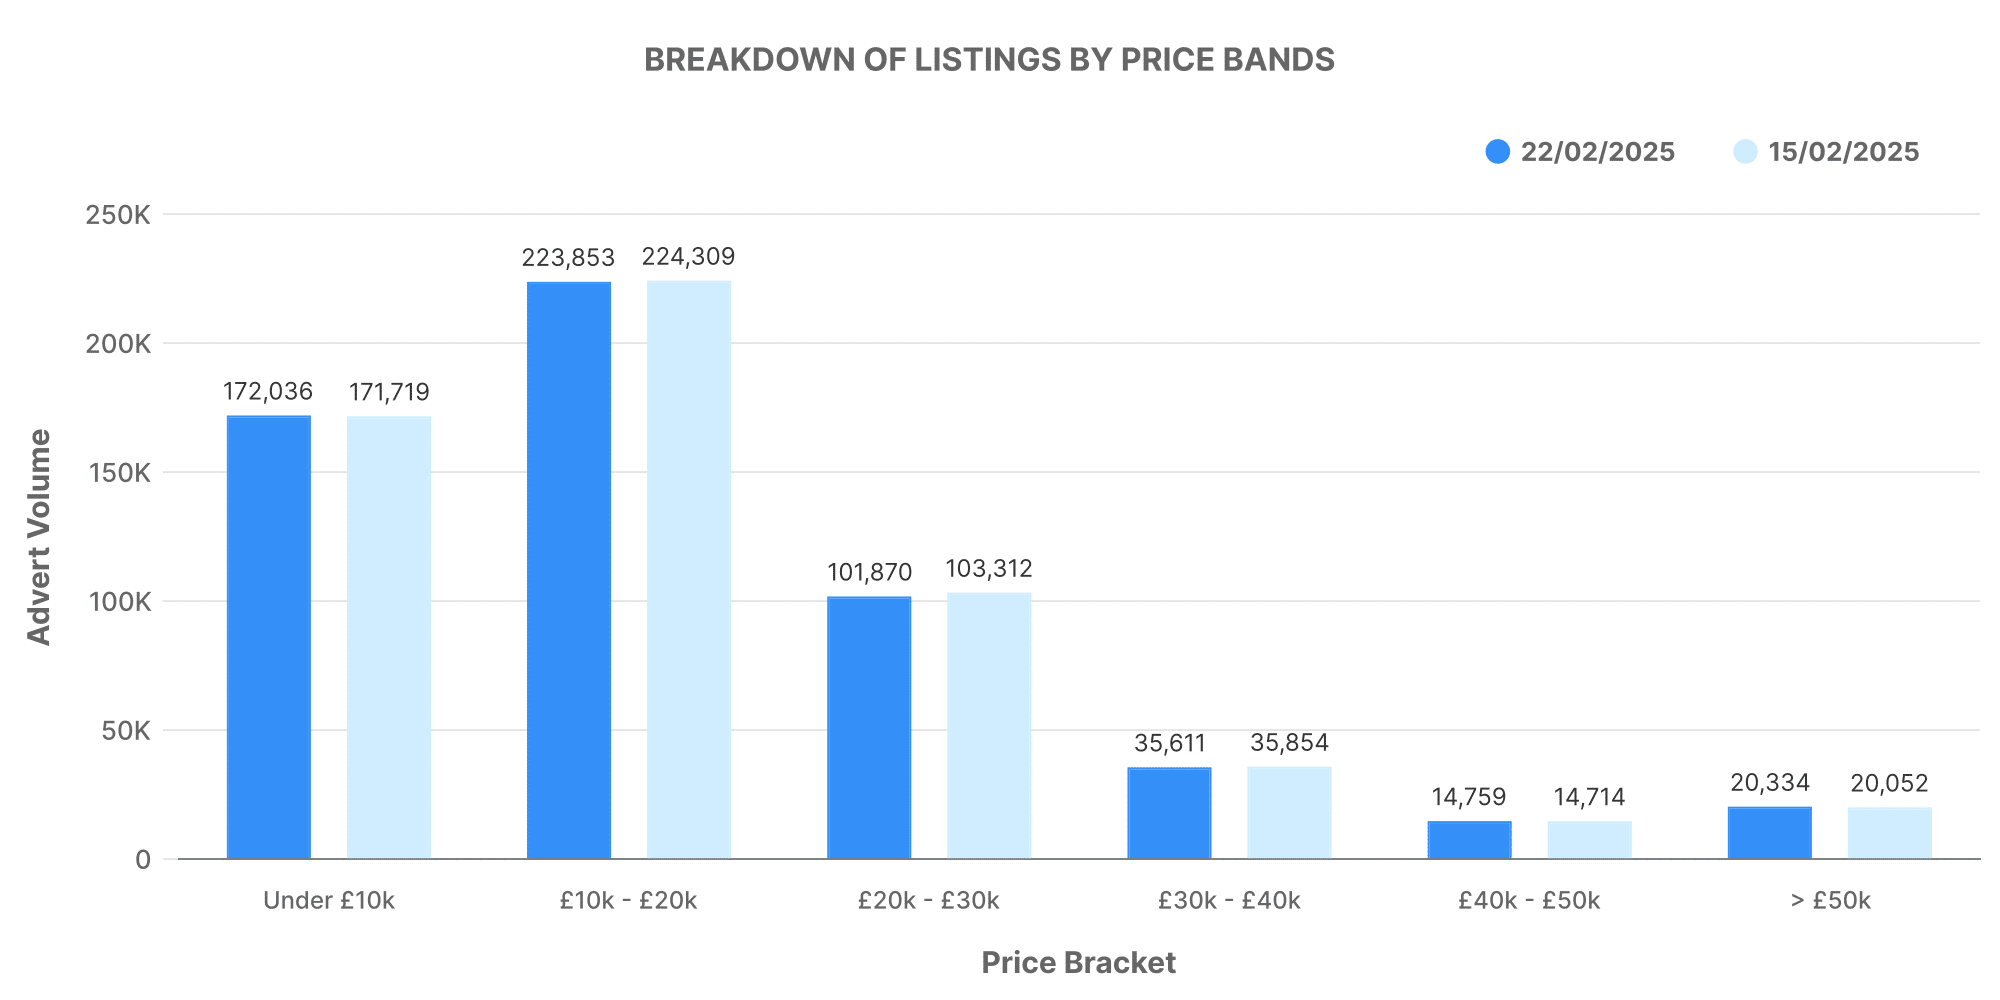
The image above divides ICE car listings into different price bands. A significant number of ICE car listings span the £10,000 – £20,000 price range, with a substantial volume further reaching between £20,000 – £30,000.
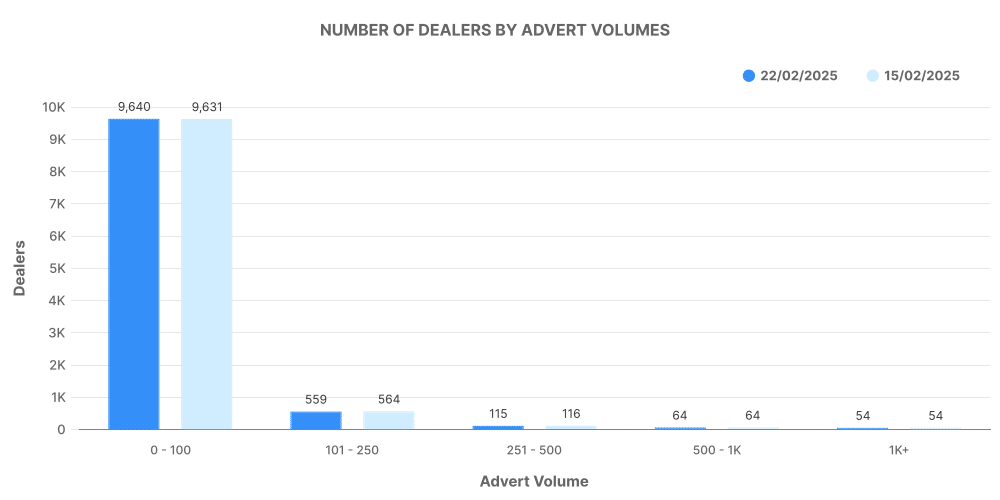
For ICE cars, the majority of dealers listed between 101-1000 vehicles. This substantial inventory underscores the prevalent footprint of ICE vehicles in the used car market.
The Impact of EV in the Used Car Market
Transition to more sustainable transport methods has brought about a substantial expansion in the electric used car market. For the same week, the market registered a total of 89,170 used EVs listed across 4,529 dealerships.
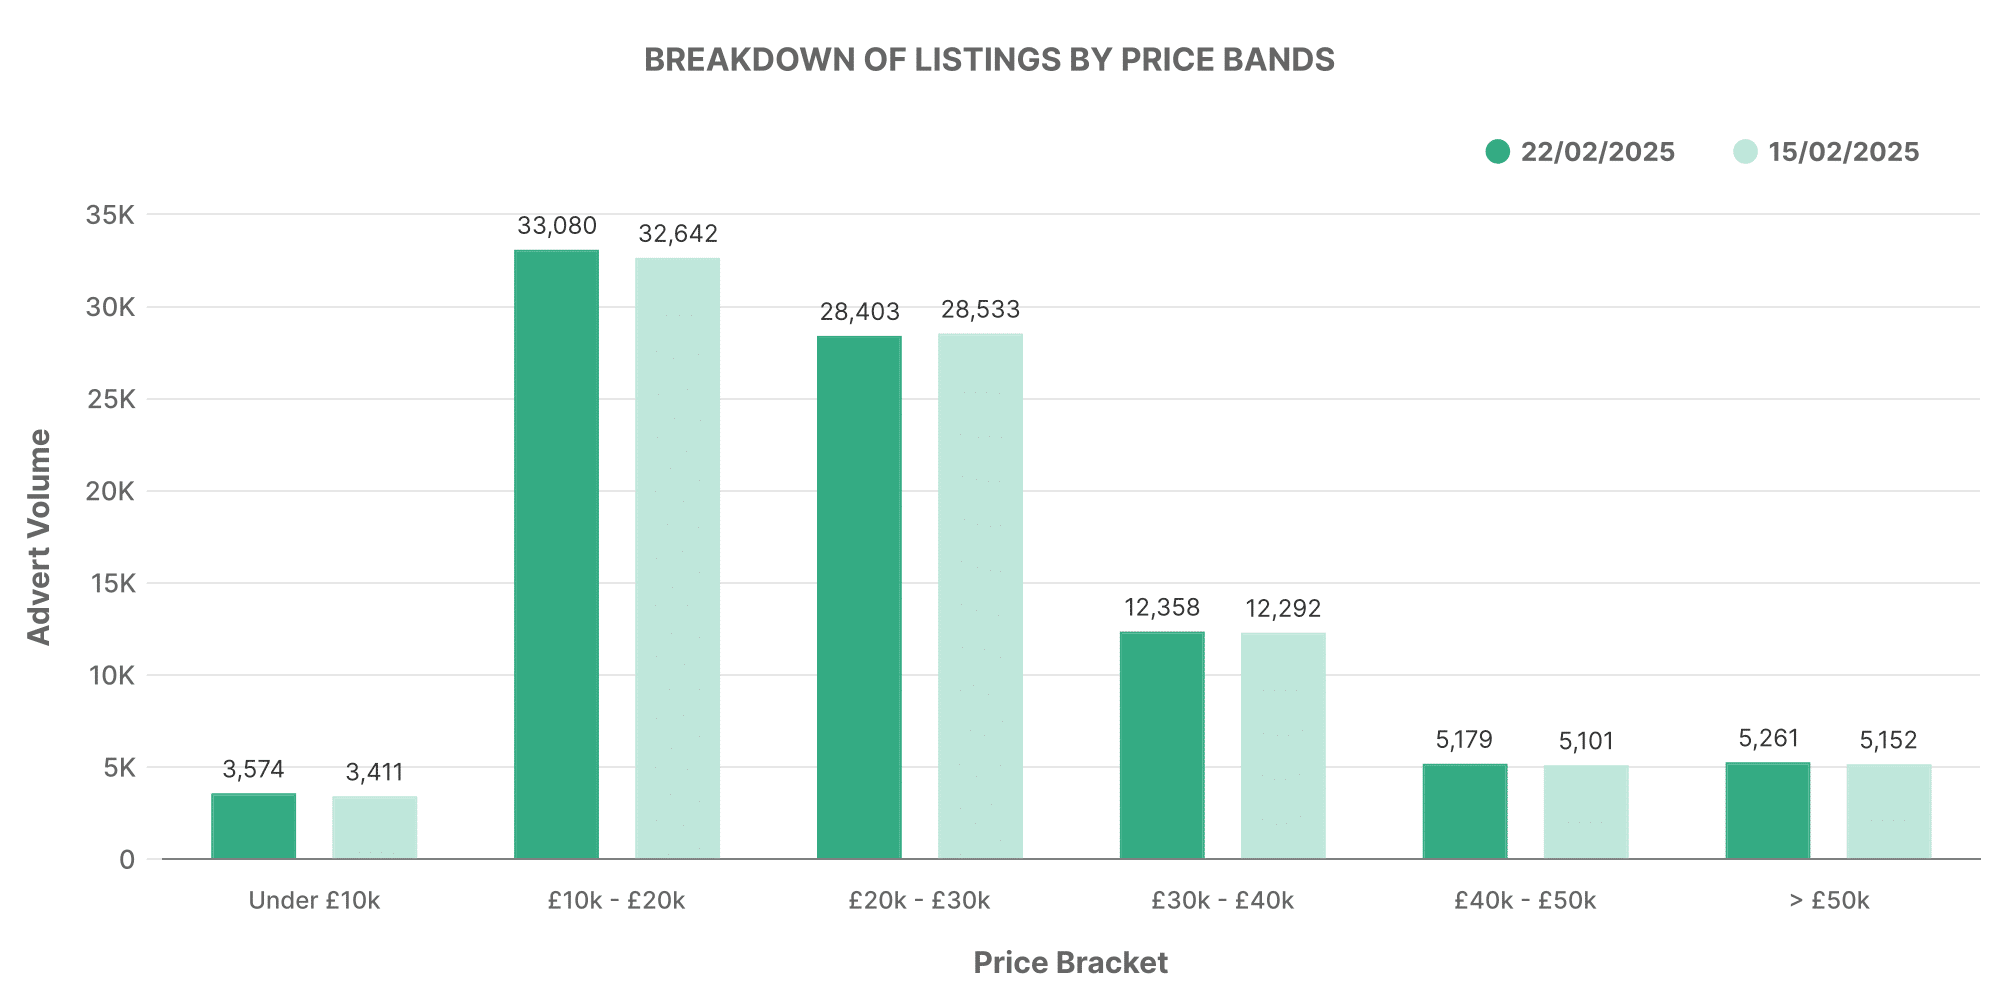
This graph signifies the detail of EV advert listings categorised by price bands. Most EV listings are situated within the £10,000 – £20,000 bracket. However, a notable volume of listings also reach into the £20,000 – £30,000 and £30,000 – £40,000 ranges, demonstrating a diversified market for EVs at varying price points.
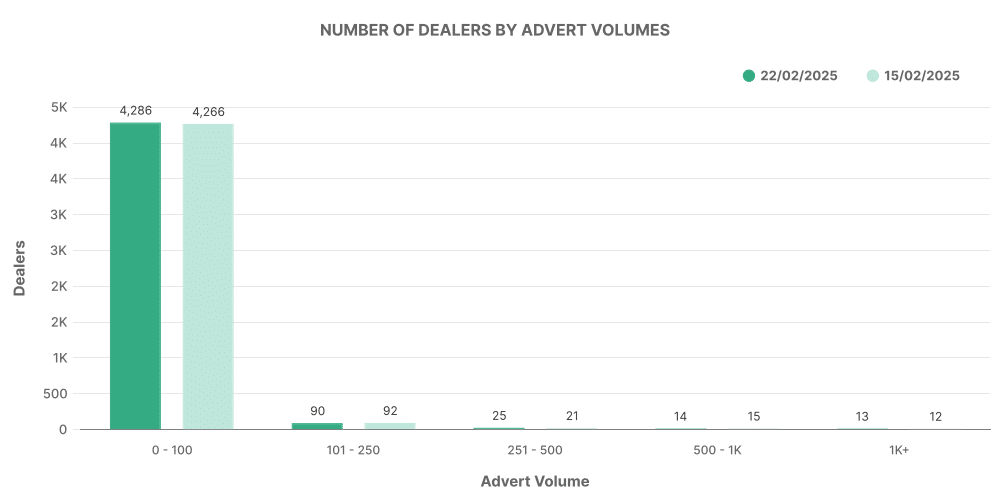
A massive share of dealers listed between 0-100 EVs, indicating the burgeoning state of the EV market compared to the well-established ICE counterpart.
Top 100 Dealers: ICE vs EV
An analysis of the top 100 dealerships in terms of listing volume for both ICE and EV markets provides fascinating insights into the market dynamics.
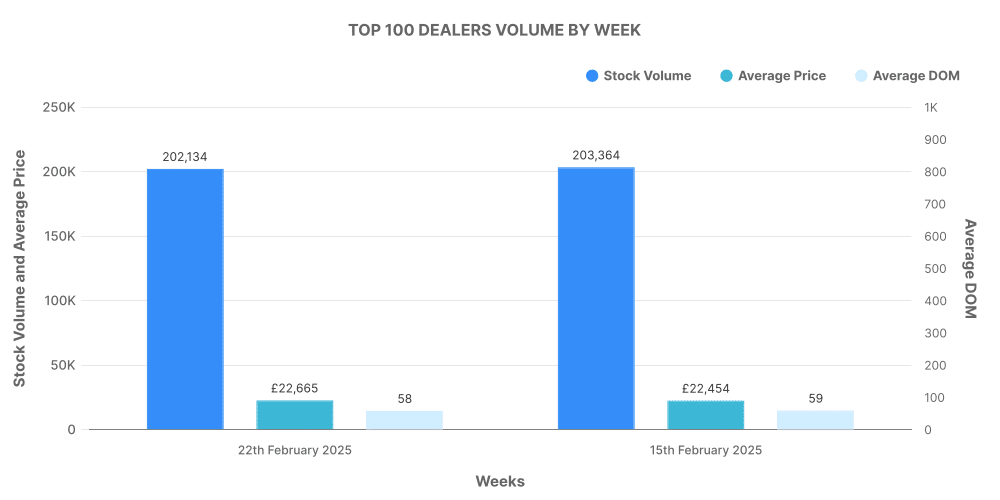
The top 100 dealers accounted for 34.8% of total ICE listings, underscoring the weight of top dealers within the ICE market. Notably, the average listing price of these vehicles slightly surpassed the market average, demonstrating the premium nature of such vehicles.
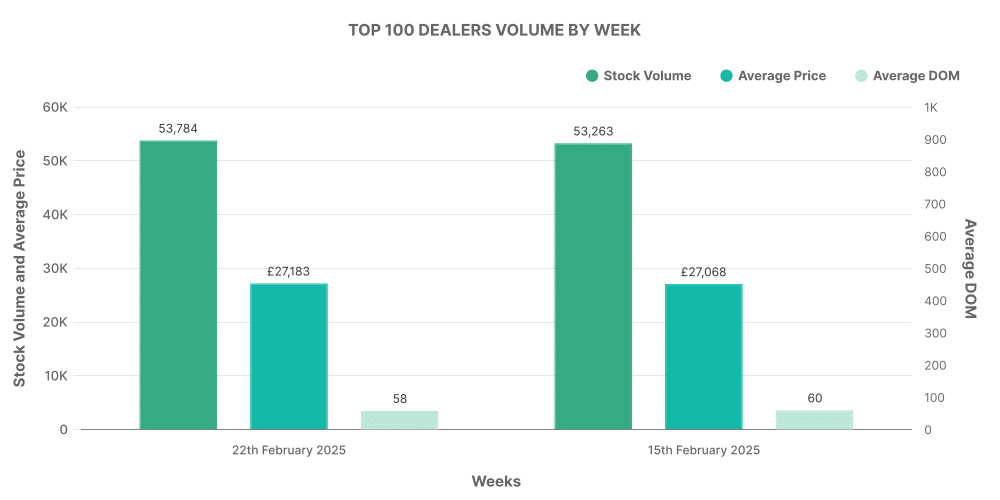
In contrast, the top 100 dealers in the EV market accounted for a 60.4% share of total EV listings, slightly lower than their ICE counterparts. However, these vehicles also boasted a higher average market price, signifying the quality of vehicles provided by top dealerships.
Comparison: ICE vs EV
Analyzing the data, we observe the used EV listings account for 15.35% of the total used car market in the UK. The average price of EVs slightly surpasses their ICE counterparts, at £26,597 compared to the £18,727 average price for ICE cars. Moreover, top EV models like the ‘Toyota Yaris’ and the ‘KIA Niro’ dominate the EV market.
Providing critical insights and updates on UK’s used car market trends, Marketcheck UK aims to enable businesses in the automotive industry to make more informed decisions. We provide comprehensive data on every current and historical used car advert listed in the UK. For further information, please get in touch.
Next week: 1st March | Previous week: 15th February
