UK Weekly Used Car Market Data – 8th March 2025
The need for objective, data-based insights becomes crucial in shaping strategies and operational decisions in the automotive sector. Putting this belief into action, we bring you the weekly used car market analysis for 8th March, 2025. With a particular emphasis on the growing electric used car market, we venture into uncovering UK car price trends and other relevant automotive market insights.
Used Car Market (Internal Combustion Engine – ICE)
Between 1st and 8th March, 2025, a total of 585,627 ICE used cars were listed across 10,449 dealers. This figure stands in comparison to last week’s 574,288 listings by 10,460 dealers.
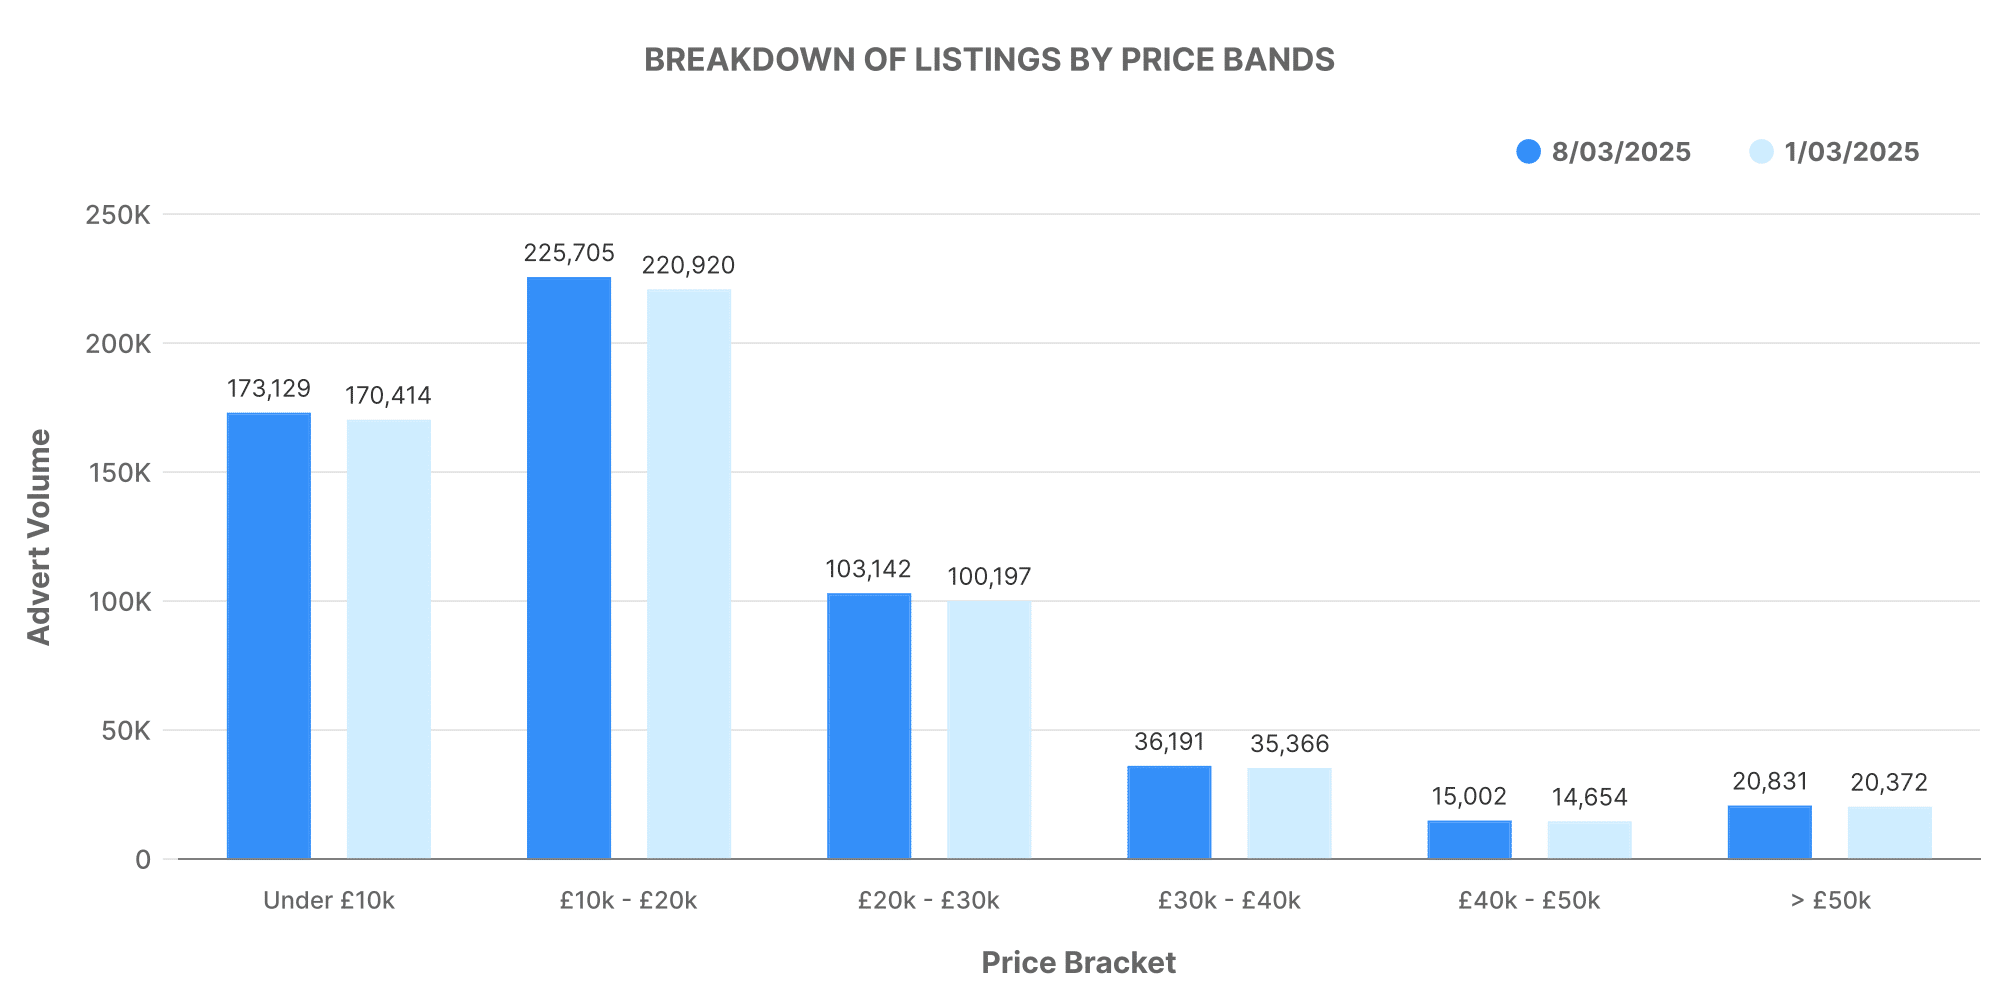
Breakdown of these listings by price bands reveals that the highest number of ICE vehicles were priced in the budget of £10,000 – £20,000. Interestingly, the average price of ICE cars for this week has shown a nominal increase of 0.11%, settling at £18,772 from its previous £18,752.
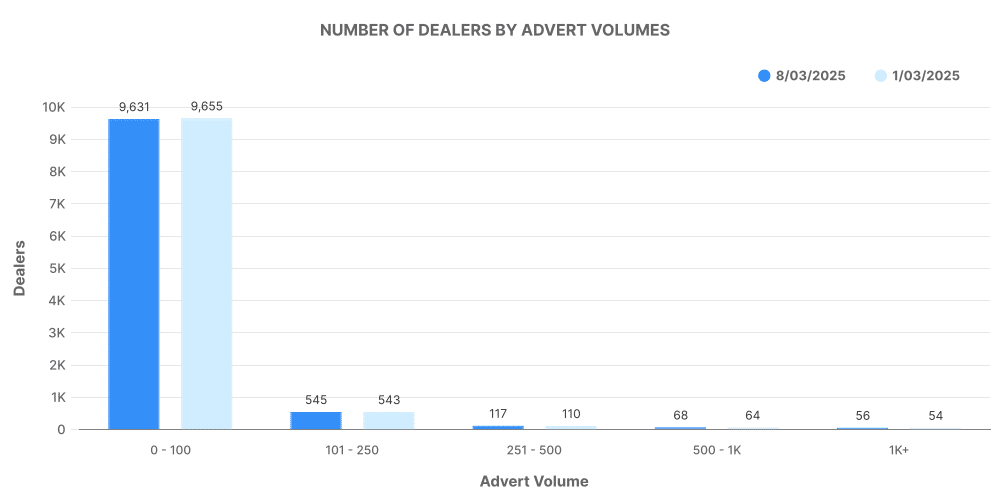
Analysing the number of adverts per dealer, it’s evident that most ICE dealers listed between 0-100 vehicles, indicating that the market is widespread, accommodating dealers of varying capacities.
Electric Used Car Market (EV)
In the same period, there were 91,094 EVs listed by 4,614 dealers, indicating an increase from the previous week that recorded 88,812 listings by 4,559 dealers.
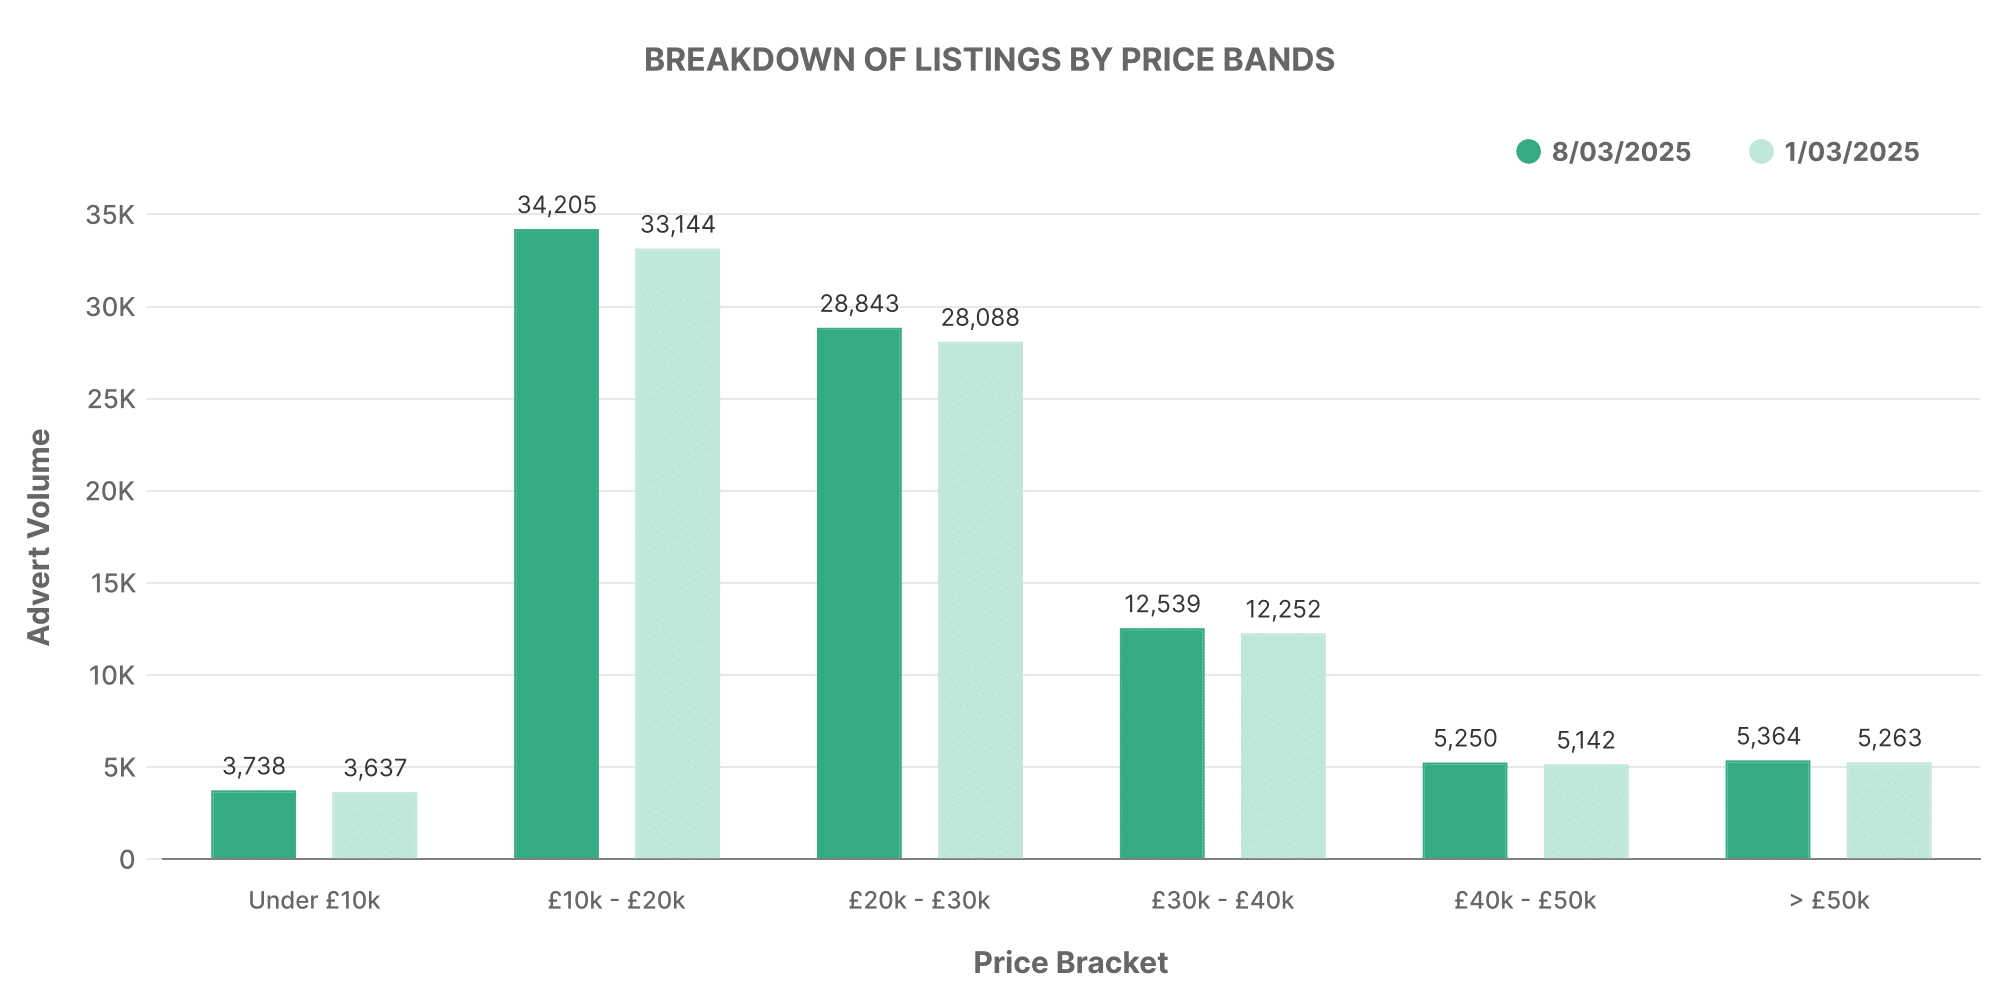
Looking into the price bands of these EVs, the majority of the cars ranged within £10,000 – £20,000, a trend similar to ICE cars. There was, however, a slight decrease in the average price, from the previous week’s £26,569 to the current £26,528.
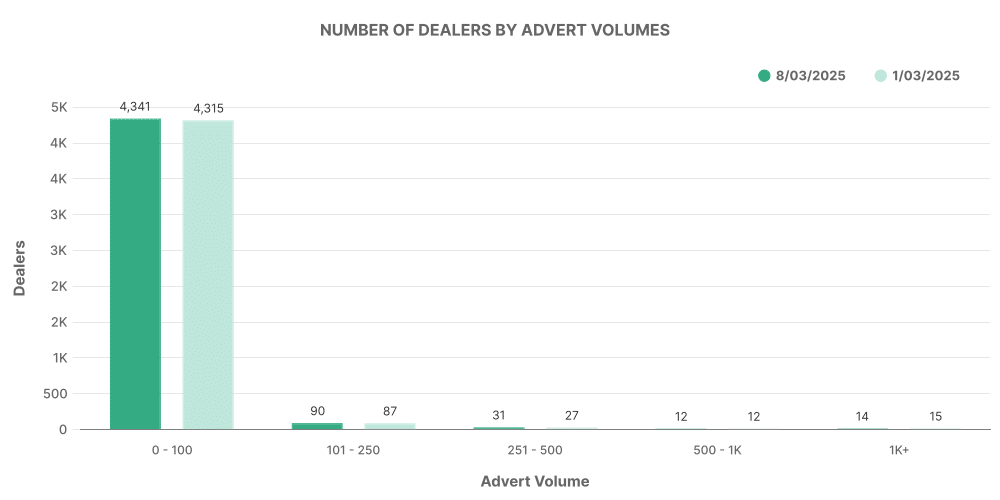
Unlike the ICE vehicle market, most EV dealers listed between 0-100 vehicles, indicating the relative novelty of the market for these cars compared to ICE vehicles.
Comparison: ICE vs. EV
Interestingly, the percentage share of EV listings has seen a minor increase from 15.46% to 15.55%. In the world of used cars, the average price of EVs (£26,528) continues to remain higher than that of their ICE counterparts (£18,772).
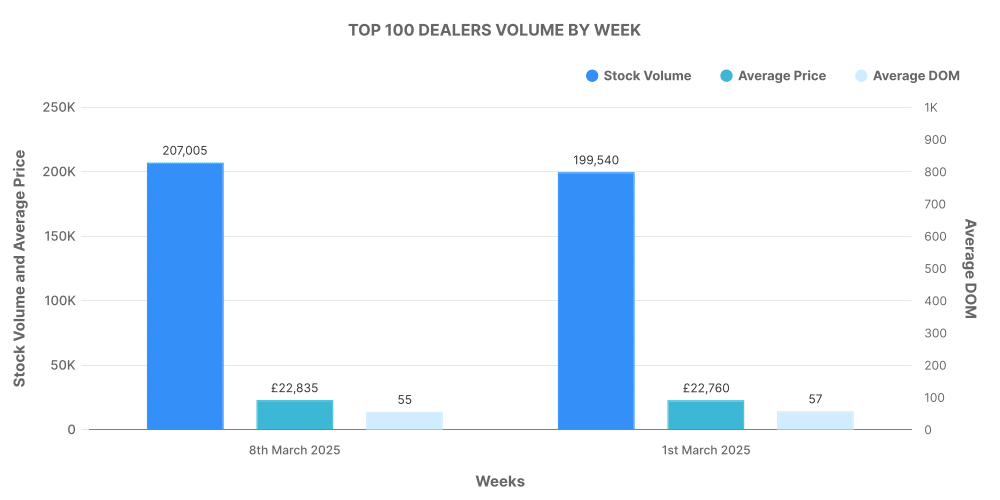
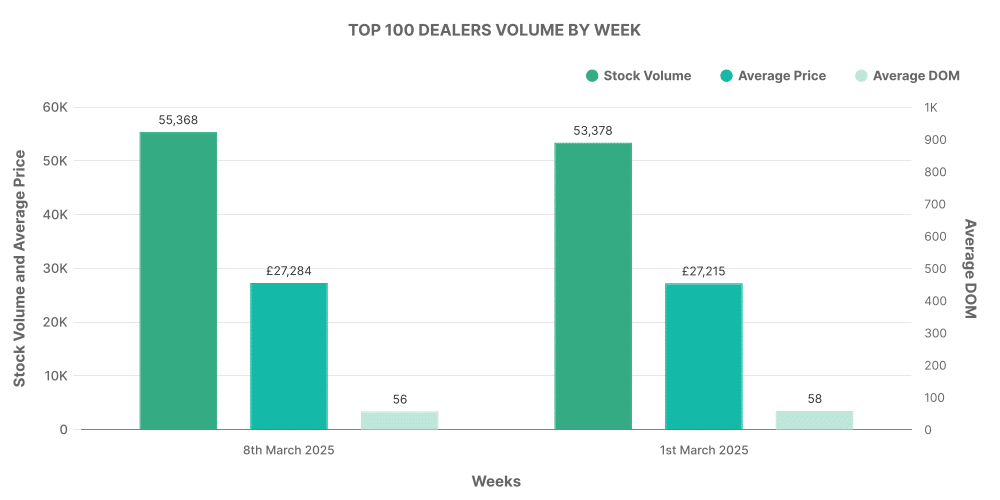
In both ICE and electric used car markets, the top 100 dealers account for 15.5% and 18.7% of total listing volumes respectively.
Our observation also shows the top 10 selling EVs for the week, led by Toyota Yaris with 3,676 listings.
As we progress into the year, we will continue monitoring these trends to extract useful insights that enlighten our automotive market understanding. Stay connected with MarketCheck UK for these periodic insights.
Next week: 15th March | Previous week: 1st March
