UK Weekly Used Car Market Data – March 15, 2025
An integral part of succeeding in any industry hinges on understanding market trends. Within the automotive industry, specifically the used car market, the landscape is constantly changing. Keeping up with these shifts can greatly influence decisions and strategies for businesses within the industry. This is especially true when considering the rise of electric vehicles (EVs) rising in popularity and making waves in the UK car market.
In this article, we take a deep look into key automotive market insights and UK car price trends within the internal combustion engine (ICE) and electric car markets.
The Used Car Market: Internal Combustion Engines (ICE)
Looking first at the traditional used car market, this category encompasses vehicles with internal combustion engines (ICE). Over the week ending on March 8, the market witnessed total listings of 585,627 from 10,449 dealers. Fast forward to the week ending on March 15, the total number of listings experienced a slight increase to 593,967 listed by 10,419 dealers.
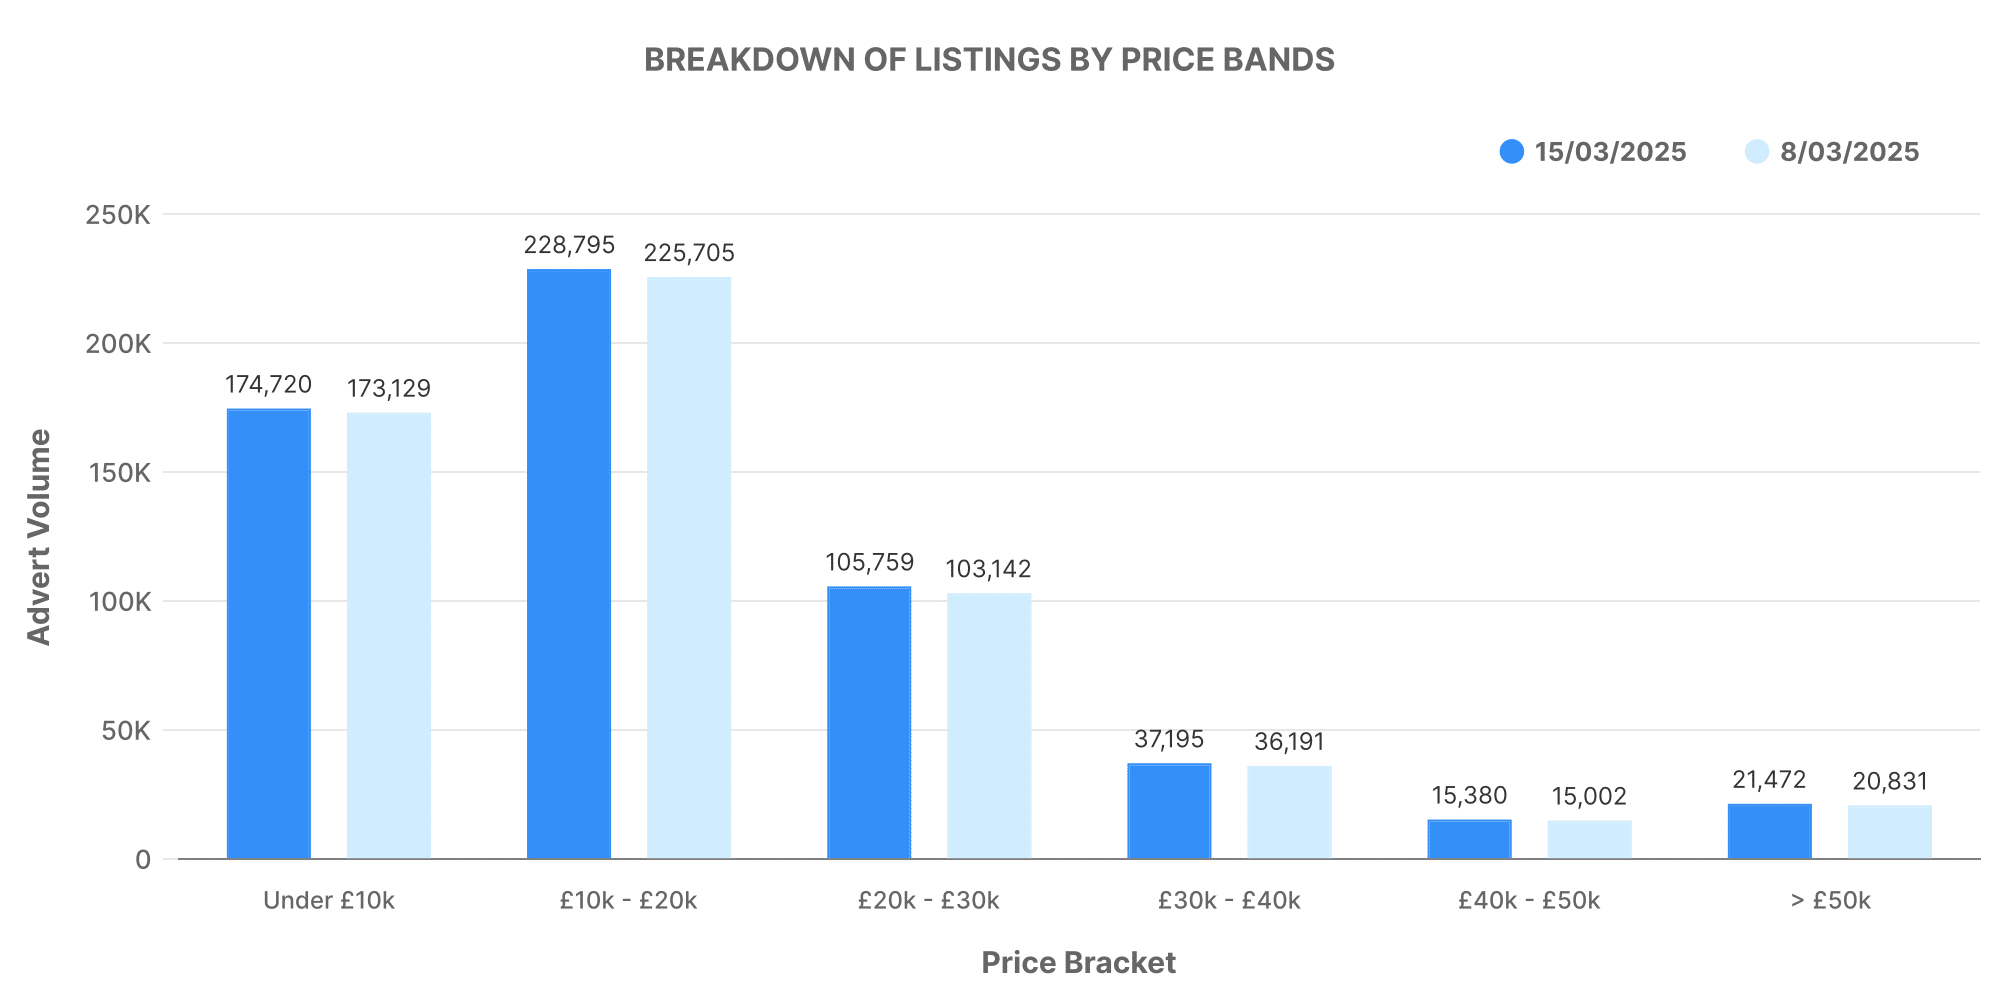
Taking into account the listed price range for ICE vehicles, the majority available were within the £10,000 – £20,000 bracket. Meanwhile, a significant number of listings fell within the £20,000 – £30,000 range. This information can be further visualised in the following graph.
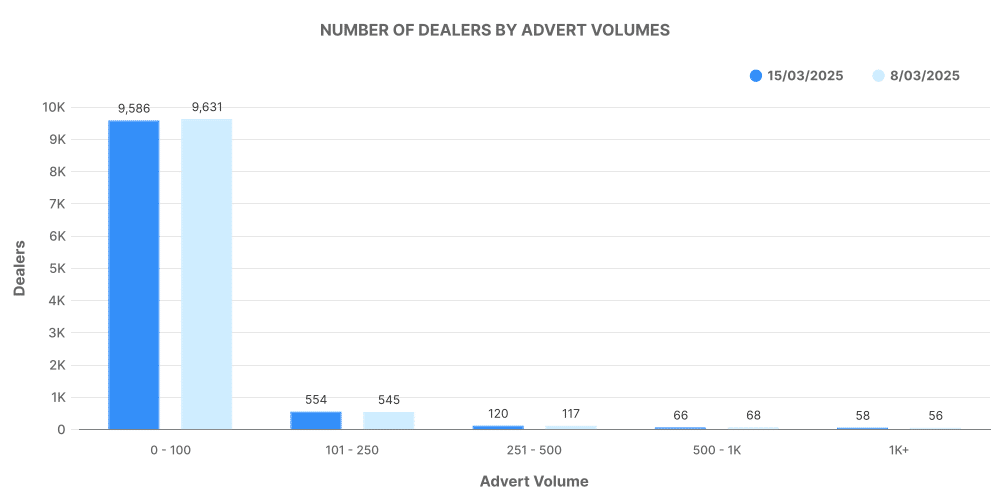
The data suggests a market that is somewhat balanced; encouraging participation from car dealerships of varied capacities, as shown by the following graph:
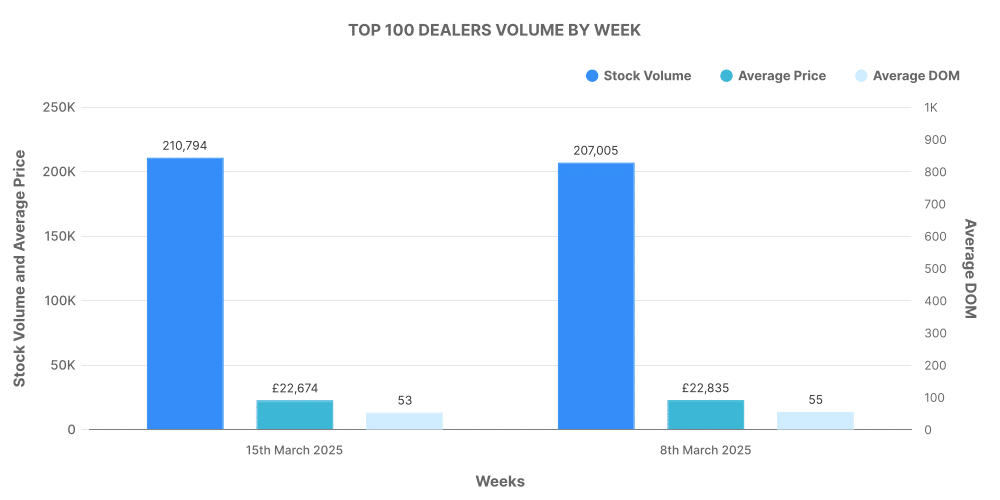
Further details show that the top 100 dealers accounted for a substantial 15.5% of total ICE listings.
The Electric Used Car Market
A growing portion of the UK used car market is the electric vehicle (EV) sector. Within the week ending on March 8, the market saw a total of 91,094 used electric vehicles listed by 4,614 dealerships. This number observed an increase one week later, with 93,206 EVs listed by 4,627 dealerships.
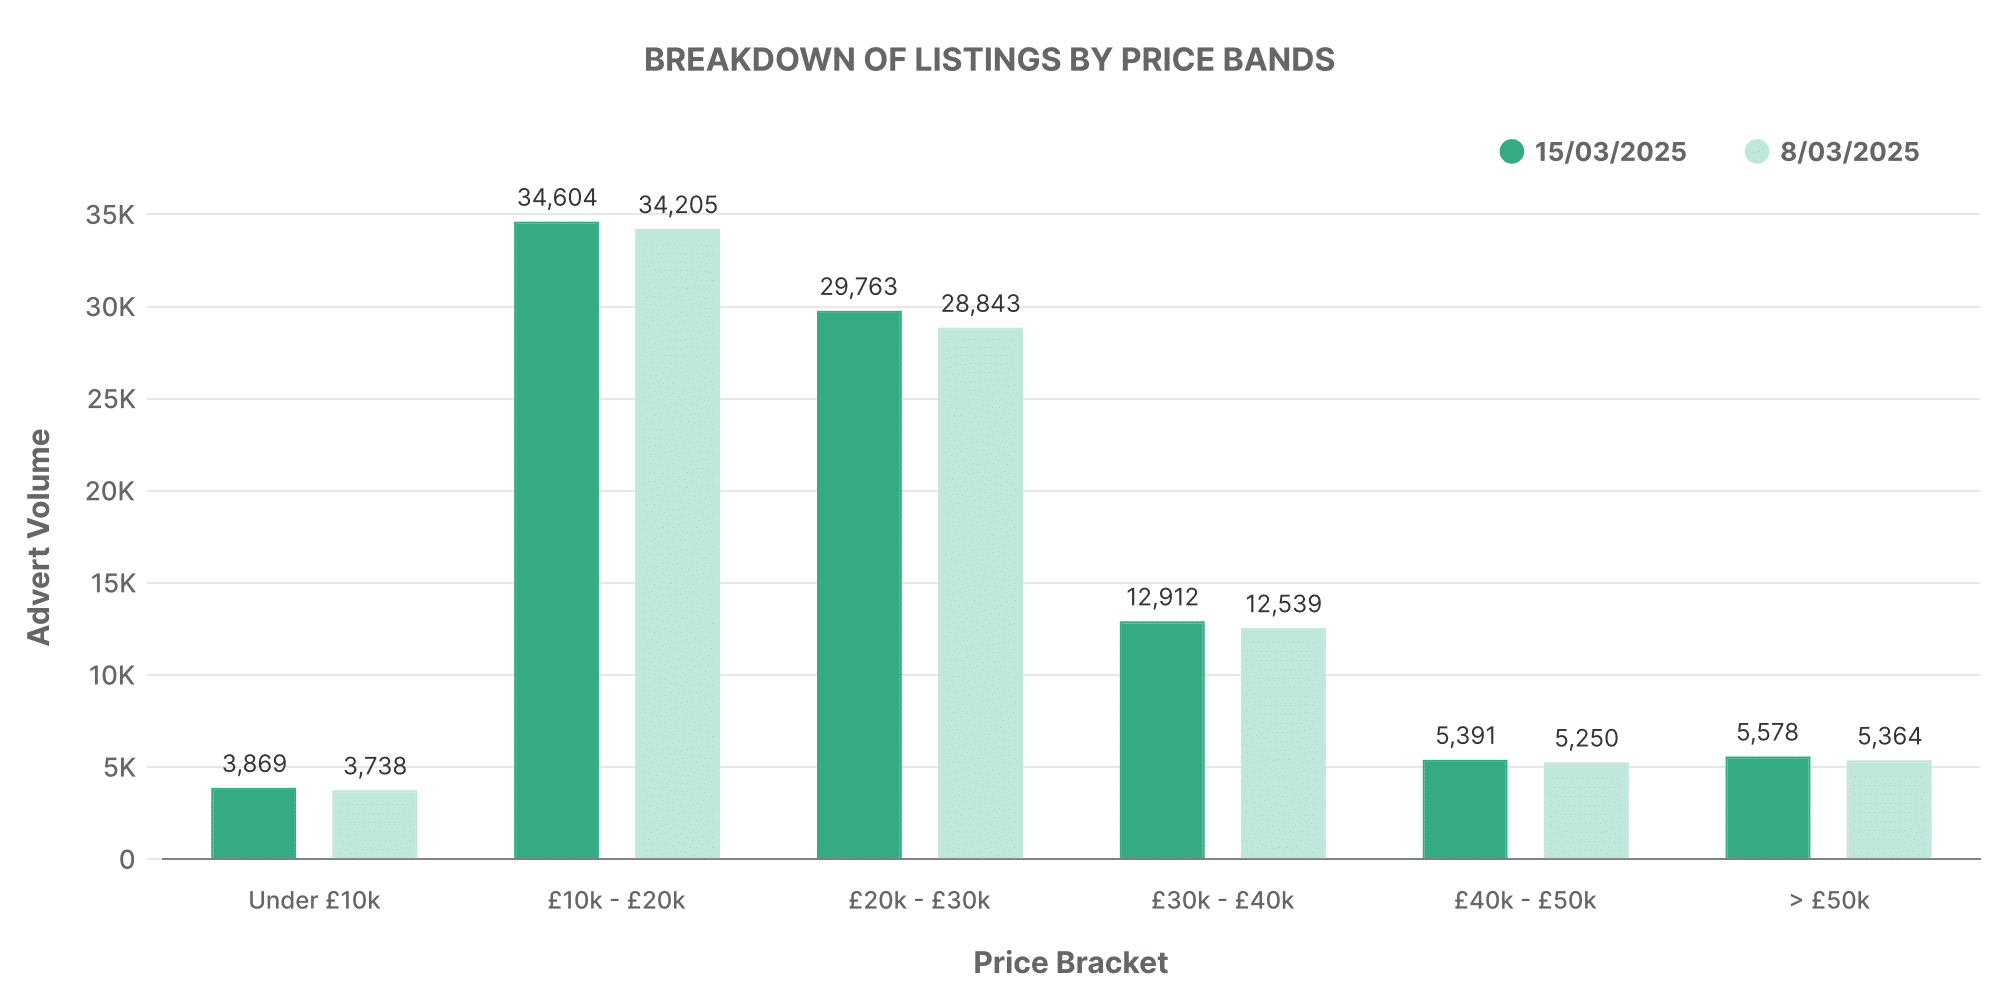
Like their traditional ICE counterparts, the majority of listed EVs fell within the familiar £10,000 – £20,000 bracket, followed by vehicles in the £20,000 – £30,000 range. Details of this data can be better represented with the following graph:
Moreover, a closer look at dealership volume for EVs reveals that most dealerships list between 0-100 vehicles. This likely indicates the growing, yet still new nature of the EV market in the UK, as shown by the following graph:
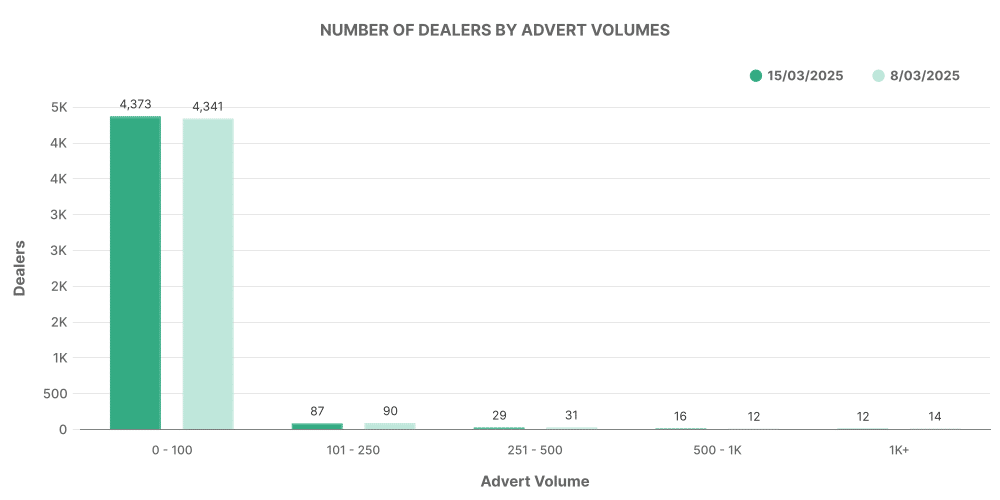
Notably, the top 100 dealers accounted for as much as 18.7% of total EV listings in the UK for the week ending March 15, 2025.
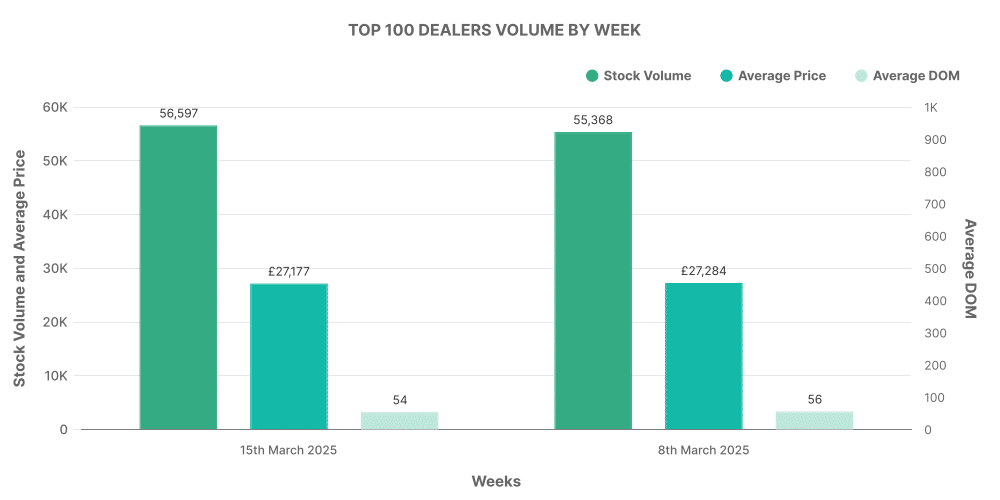
Comparison: ICE vs EV
While the traditional used car market still remains a robust and standpoint sector in the industry, it’s apparent that EVs are rapidly carving out their own substantial place within the UK market. With a growing number of total listings supplied by dealerships, the used EV market is one to keep a keen eye on.
In drawing these insights, it’s clear that understanding the used car market, both ICE and EV sectors, is paramount to businesses hoping to thrive in the ever-evolving automotive industry. Harnessing these automotive market insights, coupled with a keen understanding of UK car price trends, can greatly propel businesses ahead within the challenging yet promising automotive sector. Rely on MarketCheck UK for accurate and up-to-date data to support your business decisions.
