In the fast-paced world of used car trading, understanding shifts and sways in the market can be the key to unlocking remarkable opportunities. This analysis delves into the data around the UK’s used car market, focusing on both conventional internal combustion engine vehicles (ICE) and the increasingly significant electric used car market (EV).
Internal Combustion Engine (ICE) Vehicles
The used ICE car market continues to sustain a pace, a testament to the long-established rapport these vehicles maintain with auto traders and buyers. During week 18, a total of 615,414 used ICE vehicles were listed by 10,673 dealers.
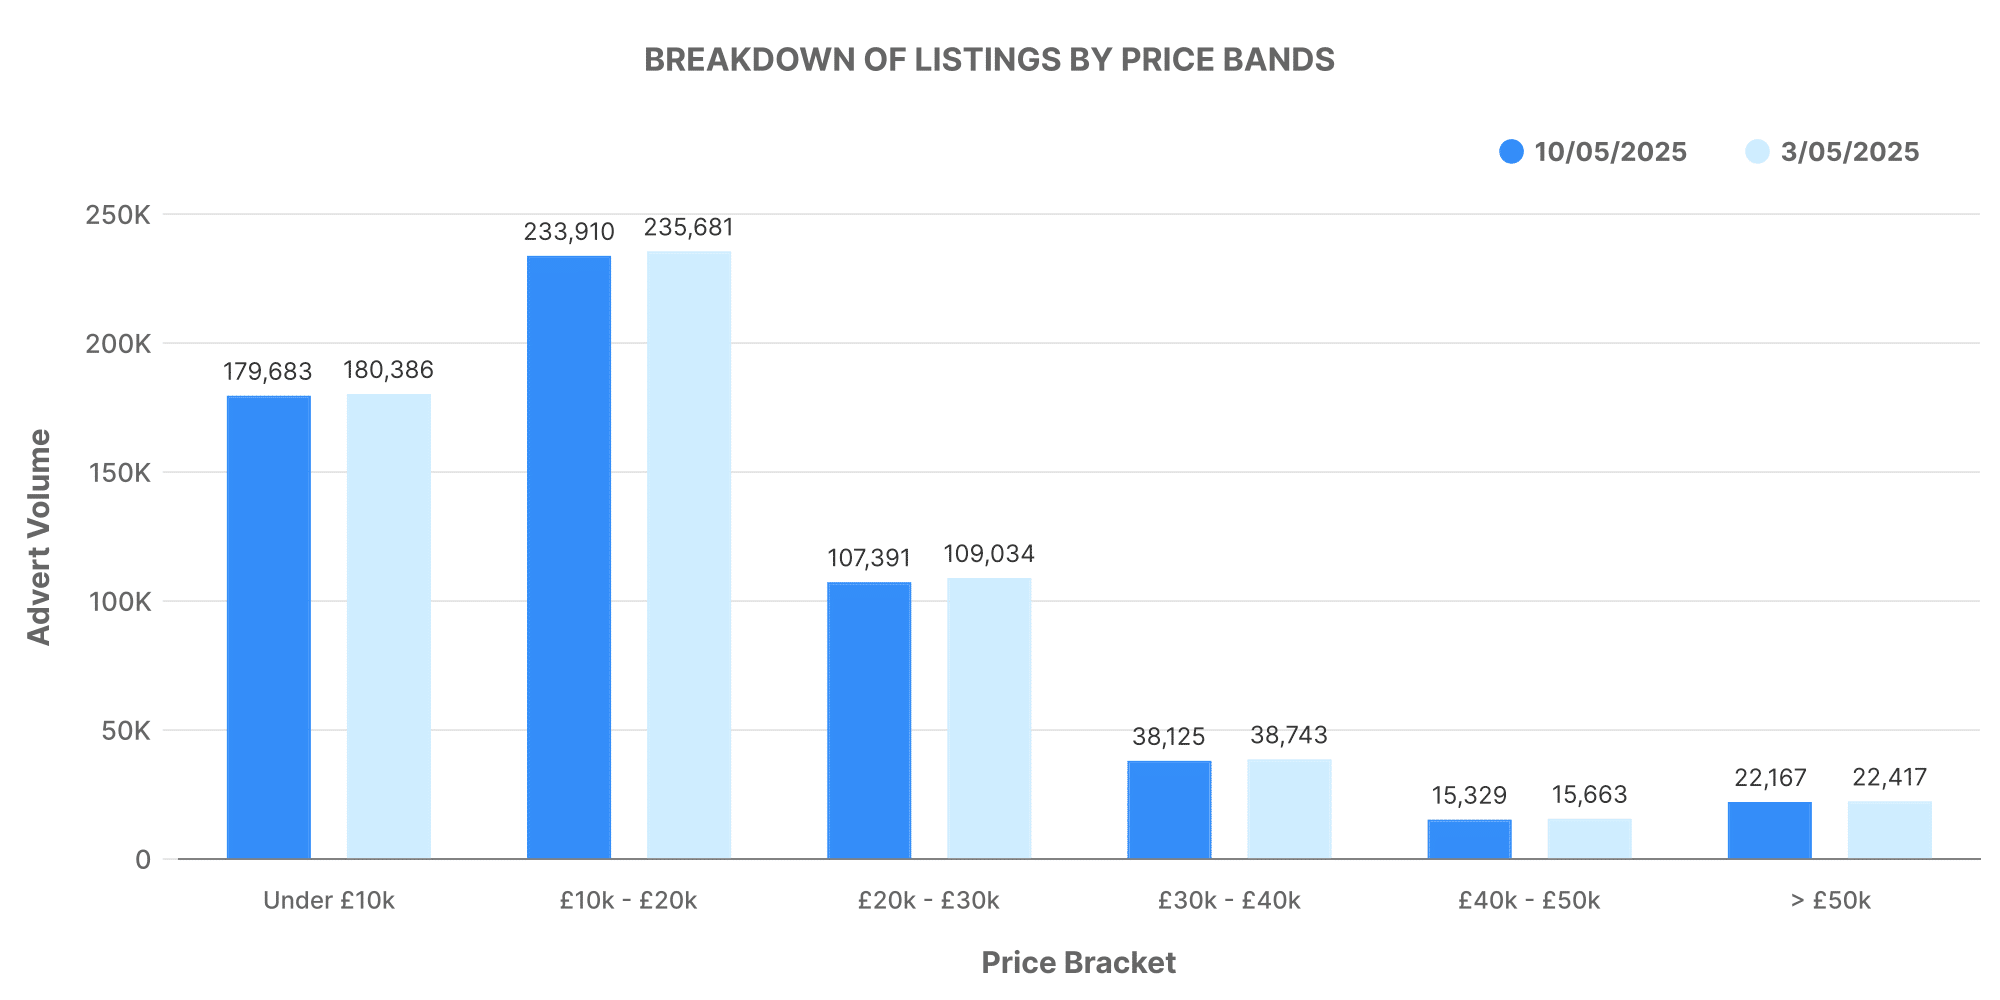
These listed vehicles were spread across varying price ranges. The overall dominant brackets were between £10,000 – £20,000 and £20,000 – £30,000, housing 235,681 and 109,034 cars respectively.
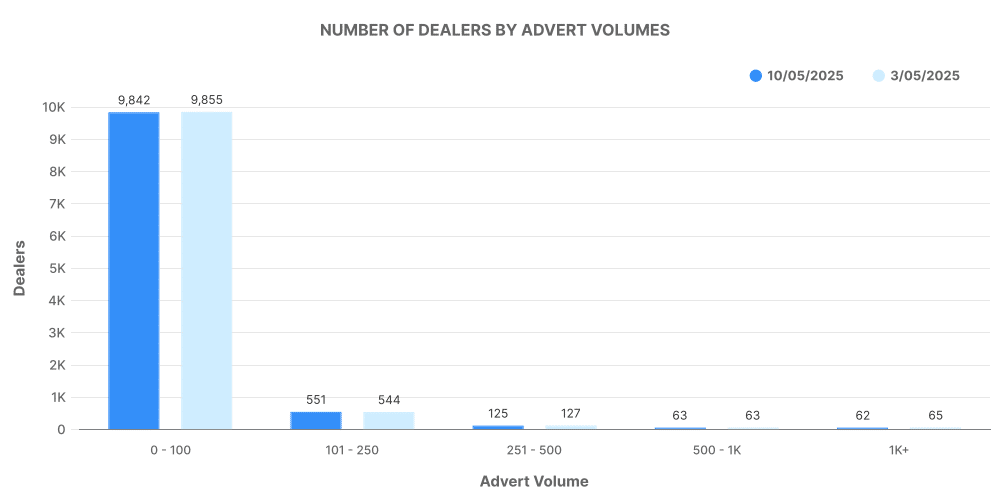
Across the dealerships, most had their listed stock volume in between 0 to 100 cars, signalling a trend towards smaller but frequent transactions.
Electric Used Car (EV) Market
Taking a pivot towards the greener side, the electric used car market (EV) is escalating at a steady rate. In week 18, there were 97,377 used electric vehicles (EV) listed by 4,721 dealers.
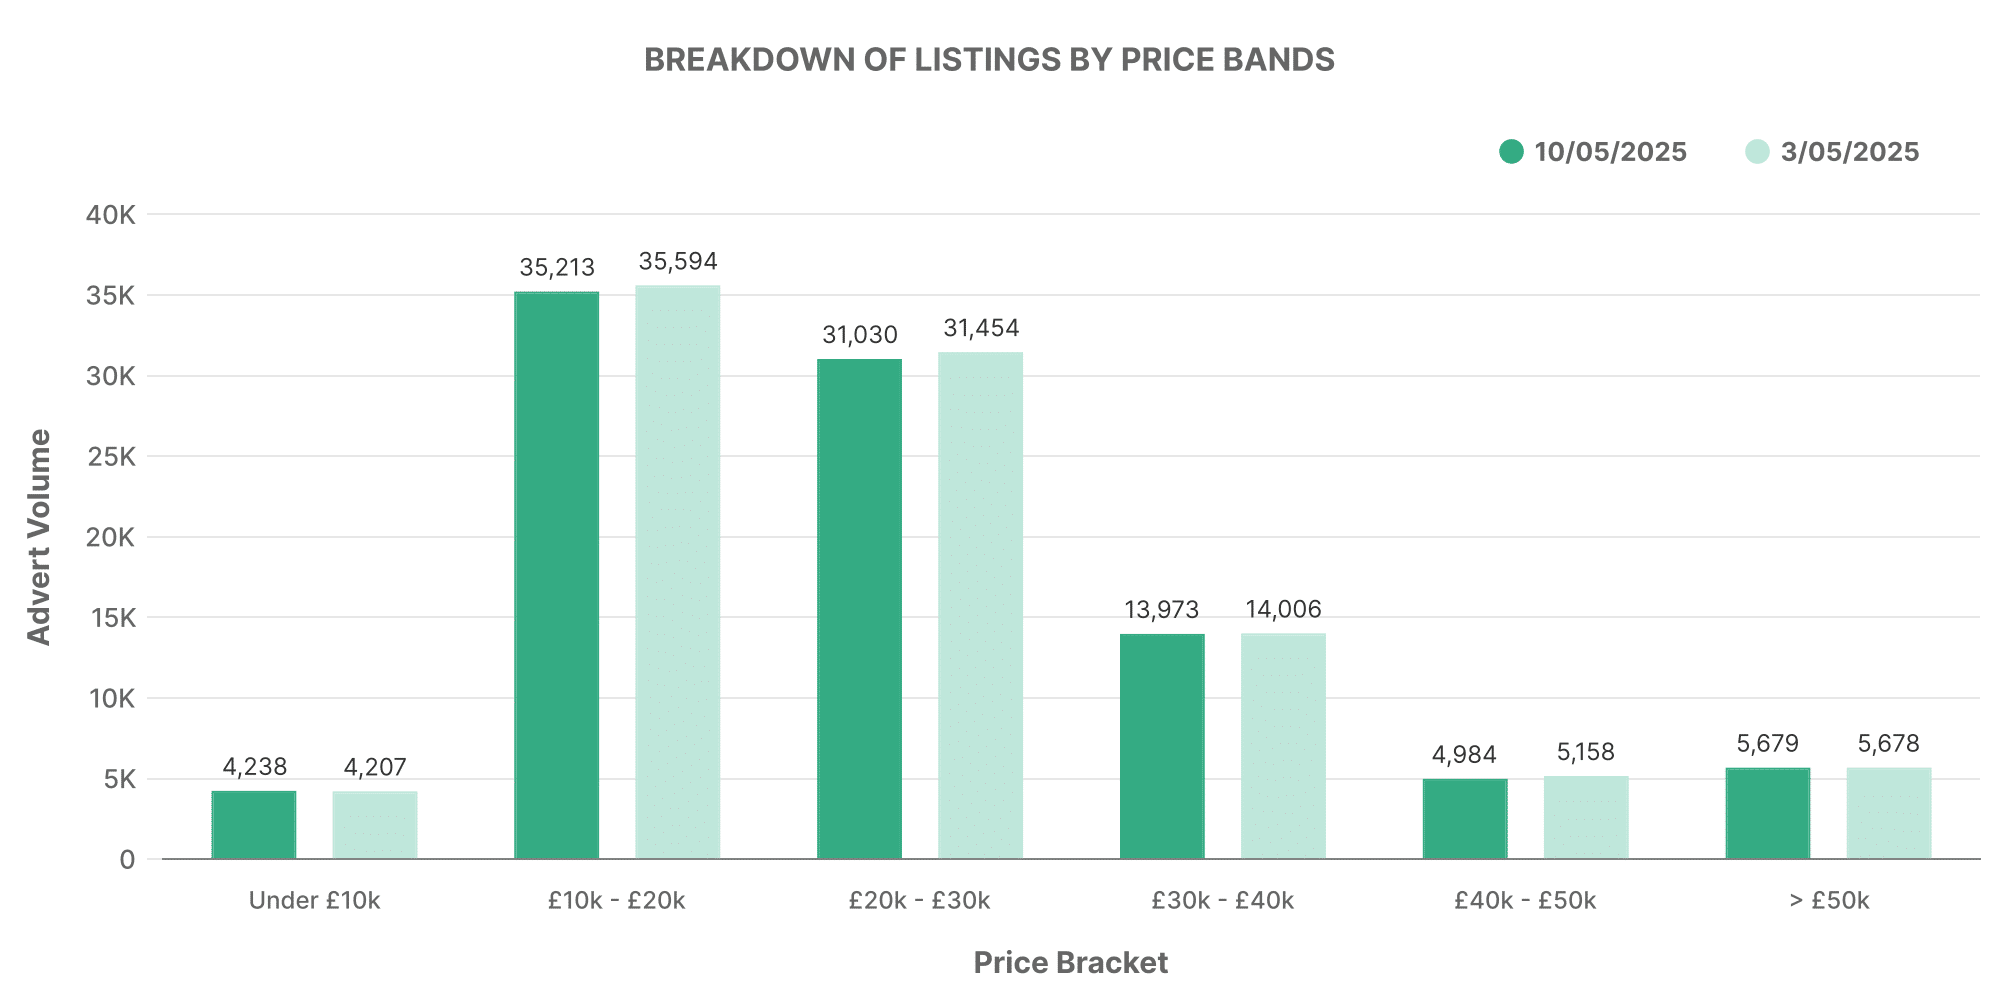
Diving into the pricing tiers of the listed EVs, it’s evident that the majority of vehicles being traded were in the £10,000 – £20,000 and £20,000 – £30,000 ranges.
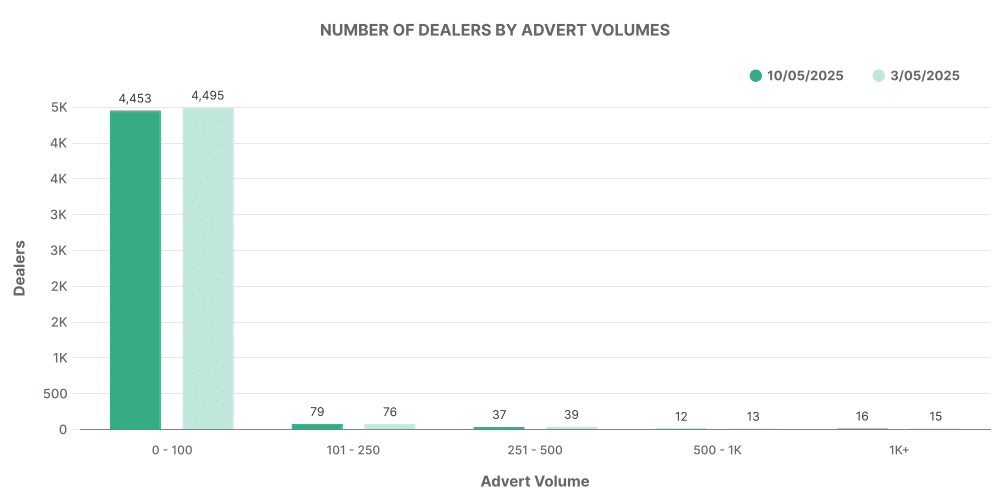
Reviewing the volume of listings per dealer reveals that most dealerships maintained a stock volume between 0 to 100 vehicles, implying a nascent stage for this market.
Comparison: ICE vs EV
Comparing the total number of listings, it’s clear that the ICE market still dominates, holding 84.18% of the total market, with EVs holding a 15.82% share. However, it’s also worth acknowledging that the average price of an EV (~£26,513) was considerably higher than that of an ICE car (~£18,877).
Top 100 Dealers: ICE vs EV
Analyzing the Top 100 dealers for both markets offers more unique insights. The accumulation of listings from the top 100 dealerships accounted for 15.5% of total ICE listings and 18.7% of total EV listings.
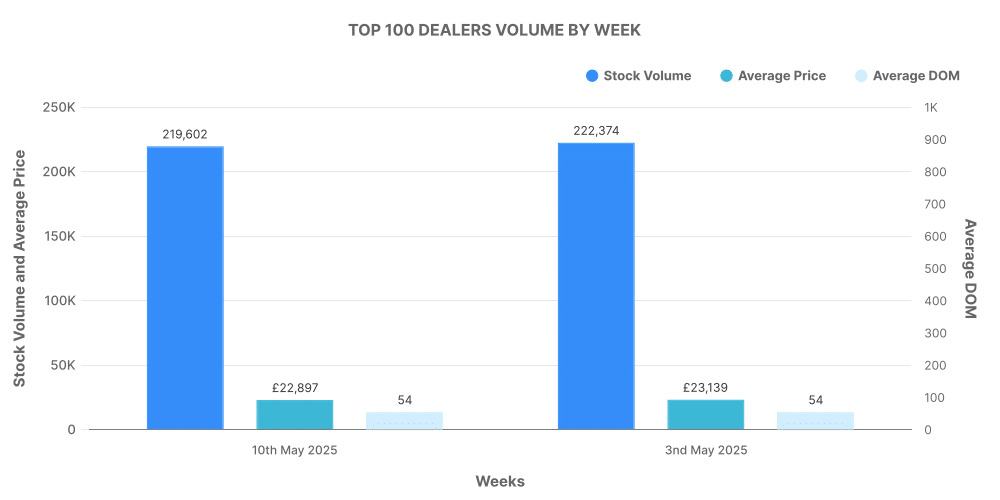
For ICE vehicles, these top dealers sold their cars at a rate slightly above the market average.
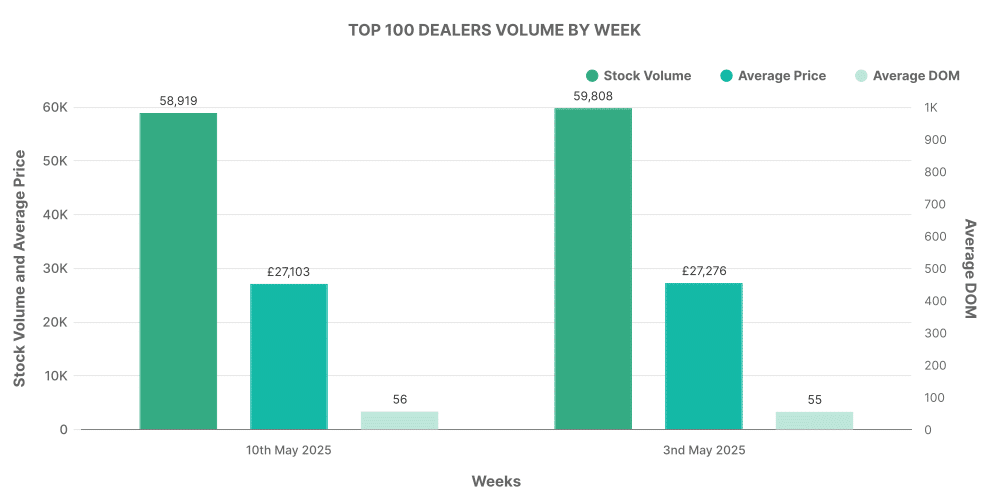
Following a similar pattern, the top 100 EV dealers too sold their vehicles at a price slightly above the market average.
In closing, whether it’s the traditional ICE vehicle or the rapidly emerging EV market, both markets are showing vibrant trading activities. As they continue to evolve and mould with varying customer preferences, in-depth market insights like these become vital tools to propel decision-making for anyone involved in the UK’s used car trading sphere.
