
Understanding the current July trends in the UK used car market is crucial for automotive dealers. This week’s data reveals valuable insights into the market dynamics, especially concerning Internal Combustion Engine (ICE) vehicles and Electric Vehicles (EVs). For dealers looking to maximise their profit margins and inventory turnover, staying updated with these trends can make a significant difference. Let’s delve into the specifics.
Overview of the Used Car Market (ICE)
Current Market Landscape
The total number of dealers for ICE vehicles stands at 10,786, slightly down from 10,802 the previous week. This represents a stable market with a marginal decrease of 0.15%. The number of rooftops, or dealer locations, has seen a slight increase to 14,694 from 14,496, suggesting a consolidation of operations or expansion of existing dealers.
Listings and Average Days on Market
The total number of listings has decreased from 910,656 to 852,581, a 6.37% drop. This reduction could indicate a higher turnover rate or fewer cars entering the used market. The average days on market (DOM) has edged up from 83 to 84 days, showing a slight slowing in sales pace.
Price Trends
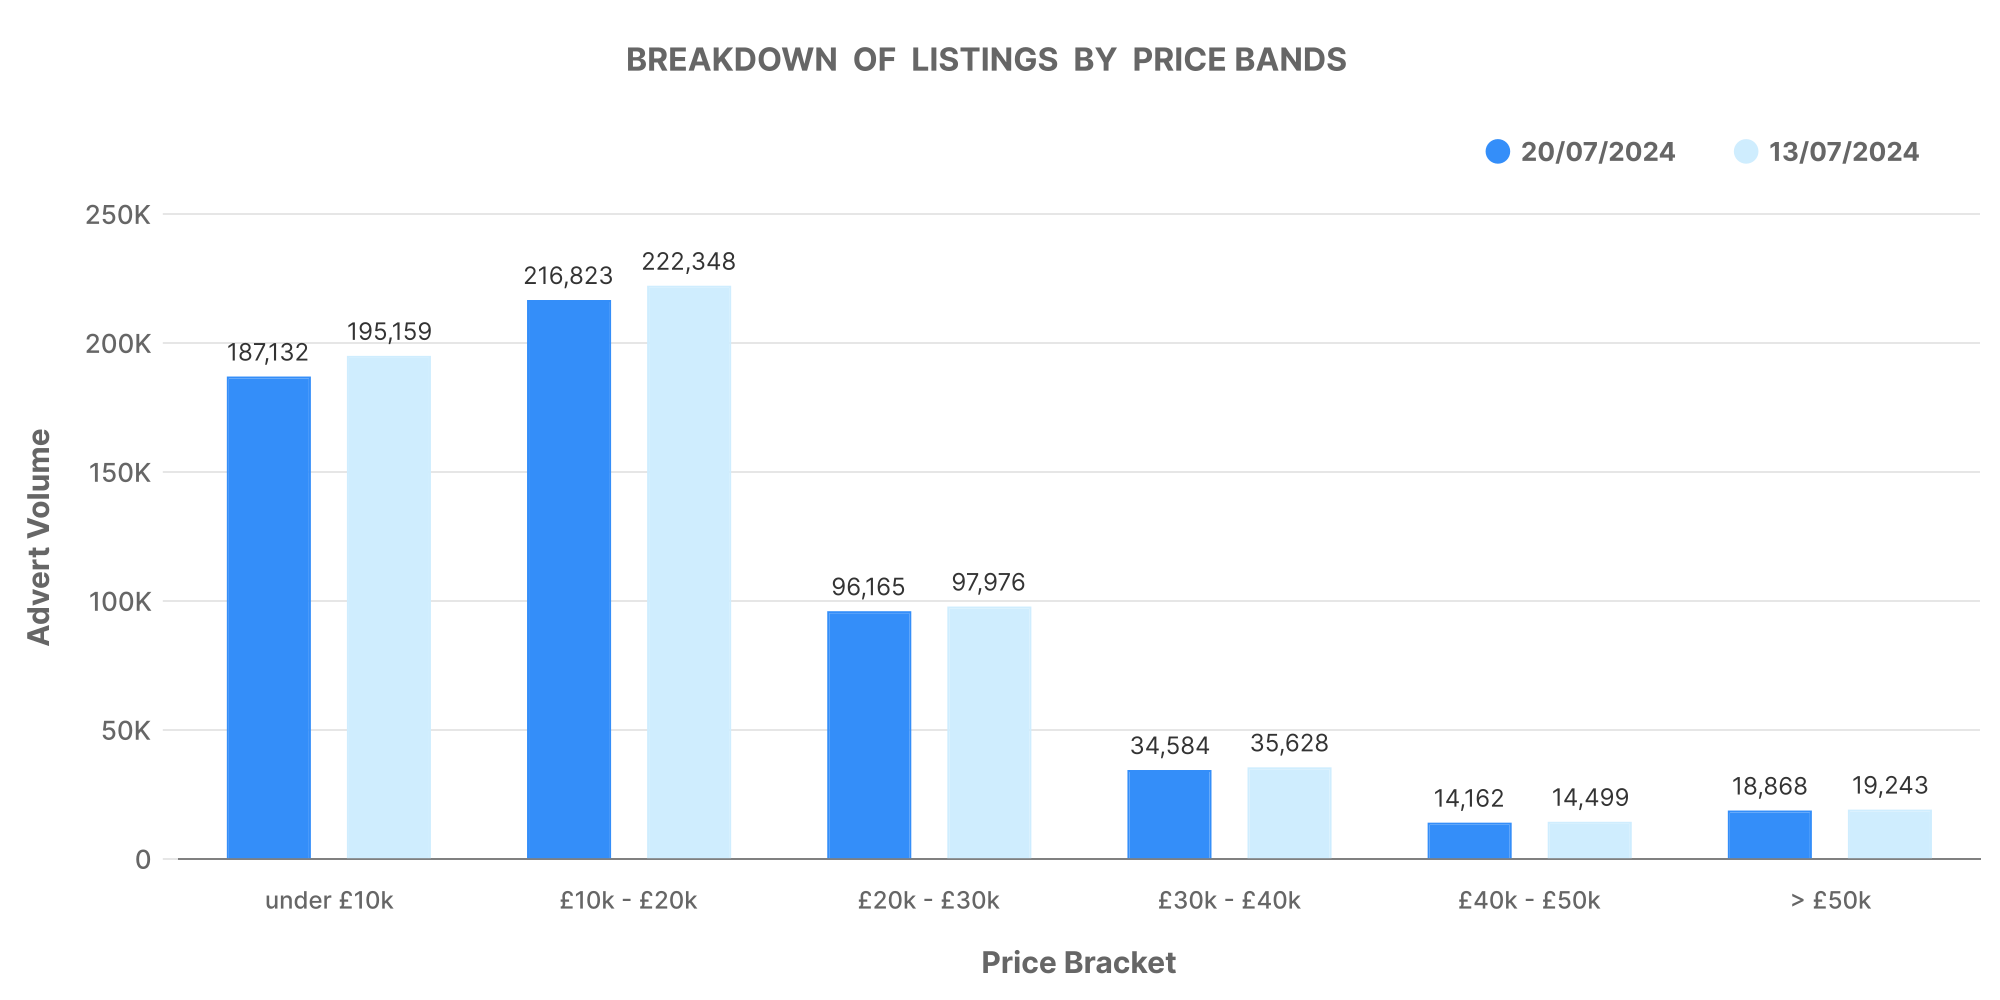
The average price of ICE vehicles has increased from £18,004 to £18,135. This 0.73% rise suggests a steady appreciation in used car values. The breakdown by price bands shows the following volumes:
- £0-10K: 187,132
- £10-20K: 216,823
- £20-30K: 96,165
- £30-40K: 34,584
- £40-50K: 14,162
- £50K+: 18,868
Dealers by Inventory Volume
The distribution of dealers by inventory volume remains consistent with minimal changes. Dealers with volumes between 0-100 cars dominate the market. This week’s analysis highlights 195,978 listings within this band, with slight decreases in higher inventory bands.
Top 100 Dealers Analysis
For the top 100 dealers:
- Stock Volume: 52 units per dealer
- Average DOM: 52 days
- Average Price: £22,116
- Price Increases: 13,259 listings
- Price Decreases: 62,908 listings

Outside the top 100 dealers, the average price sits at £16,063, with price increases and decreases showing similar trends.
Overview of the Electric Used Car Market (EV)
Market Penetration
The EV market continues to gain traction with 4,390 dealers and 7,613 rooftops dedicated to electric vehicles. Although the total listings have decreased from 133,755 to 123,504 (7.65% drop), the overall market remains robust.
Listings and Average Days on Market
The average DOM for EVs has slightly increased from 69 to 70 days. This marginal increase might indicate a need for adjusted marketing strategies to enhance sales velocity.
Price Trends
The average price of EVs has seen a slight uptick from £27,480 to £27,558, reflecting stable demand. Here’s the breakdown by price bands:
- £0-10K: 3,163
- £10-20K: 24,239
- £20-30K: 22,278
- £30-40K: 11,491
- £40-50K: 4,850
- £50K+: 4,706

Dealers by Inventory Volume
EV dealers predominantly hold smaller inventories, with 42,955 listings in the 0-100 band. Larger volume bands remain relatively sparse, indicating potential growth opportunities for dealers willing to expand their EV stock.

Top 100 Dealers Analysis
For the top 100 EV dealers:
- Stock Volume: 56 units per dealer
- Average DOM: 56 days
- Average Price: £28,125
- Price Increases: 2,628 listings
- Price Decreases: 14,269 listings

Outside the top 100 dealers, the average price is £26,694, showing slight variance in pricing strategies compared to the top tier.
ICE vs EV Comparison
Market Share and Pricing
EVs represent 12.39% of the total UK used car market, a slight increase from 12.32% the previous week in July. This growth indicates a steady shift towards electric vehicles, with the average price of EVs (£27,558) significantly higher than ICE vehicles (£18,135).
Analysis of Key Graphs
Breakdown of Listings by Price Bands
The graph showing the breakdown of listings by price bands for both ICE and EV markets illustrates the market distribution across various price points. ICE vehicles dominate the lower price bands (£0-20K), whereas EVs have a significant presence in the £20K-50K range.
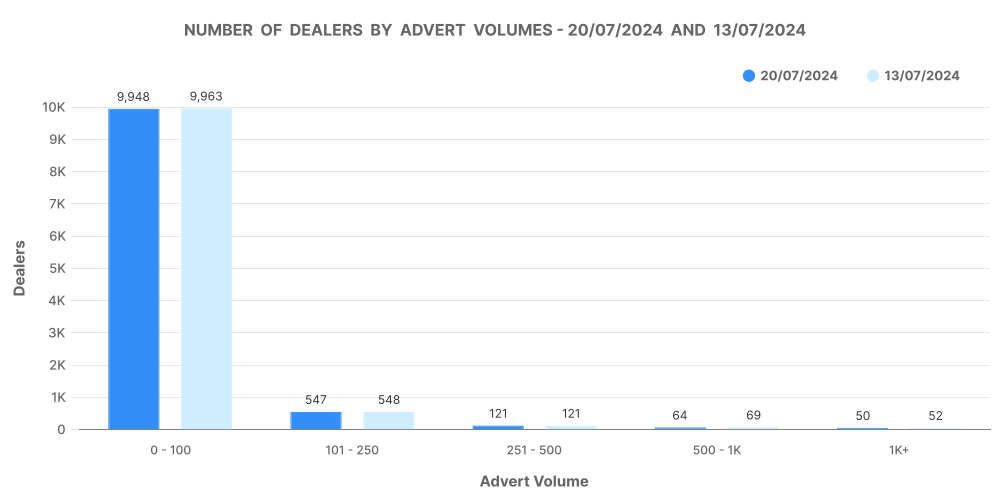
Number of Dealers by Advert Volumes
This graph highlights the number of dealers across different inventory volumes. The majority of dealers, both for ICE and EVs, operate within the 0-100 inventory volume band, indicating a highly fragmented market with numerous small-scale dealers.
Analysis of Top 100 Dealers by Volume
The top 100 dealers for both ICE and EV markets show more streamlined operations with higher stock volumes and quicker turnover rates. This segment’s ability to adjust prices and manage inventory efficiently gives them a competitive edge.
Relevance of Marketcheck UK
For automotive dealers aiming to navigate these trends effectively, Marketcheck UK offers invaluable insights. Our comprehensive data on current and historical used car market listings across the UK enables dealers to make informed decisions in July. Whether you are looking to optimise your pricing strategies, understand market dynamics, or identify growth opportunities in the EV sector, Marketcheck UK’s tools and data services provide the edge you need.
By leveraging our detailed datasets, dealers can:
- Track ‘days on market’ for precise inventory management.
- Analyse price trends to optimise pricing strategies.
- Understand market demand to stock high-demand vehicles.
- Gain insights into dealer performance and competitive positioning.
Marketcheck UK equips dealers with the knowledge to not only stay competitive but also thrive in a dynamic market. Contact us today to see how we can help your dealership excel.