An Overview of the UK Used Car Market – February 2025
February showed subtle shifts across both the electric and internal combustion engine (ICE) segments of the used car market. Listings dipped slightly month-on-month, but with over 850,000 cars on sale across both markets, dealers remain active and demand continues to diversify across vehicle types and price bands.
In this month’s breakdown, we look at the latest trends influencing car dealers, auction houses, investment firms and finance companies, with a particular focus on the electric used car market and its growing share in the UK.
Used ICE Car Market Snapshot – February 2025
The ICE market continued to form the majority of used car activity in February, with 742,912 listings recorded across 10,608 dealers and 15,048 rooftops.
- Average days on market: 85 days
- Average listed price: £18,399
Despite a 4% decrease in overall listings compared to January, average prices held steady. Dealers continue to focus on stock turnover efficiency, with time-on-market dropping slightly – suggesting stronger pricing discipline or increased consumer confidence in buying used.
Breakdown of ICE Listings by Price Bands
The distribution of ICE listings by price reflects ongoing affordability concerns and buyer caution.
- £0 – £10,000: 220,335 listings
- £10,000 – £20,000: 289,235 listings
- £20,000 – £30,000: 130,326 listings
- £30,000 – £40,000: 44,222 listings
- £40,000 – £50,000: 17,856 listings
- £50,000+: 23,991 listings
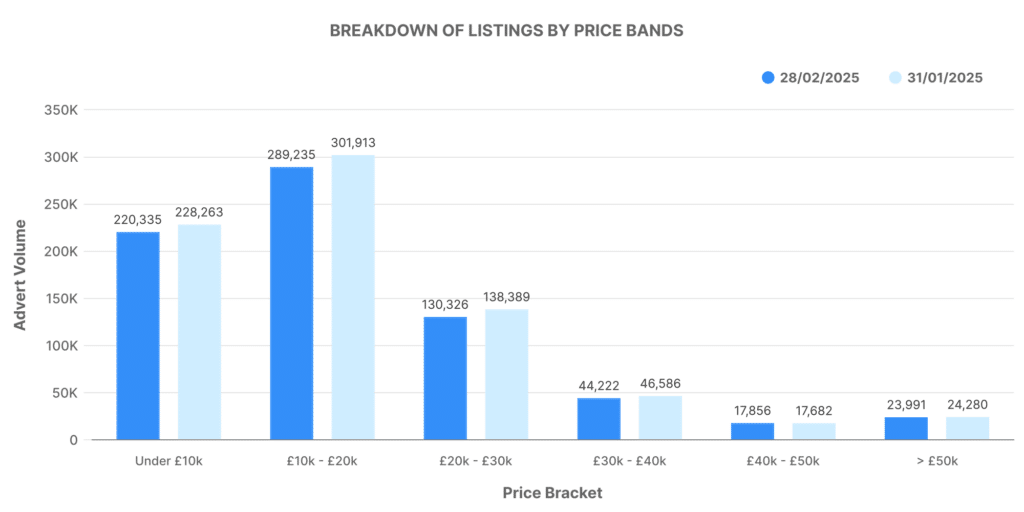
A large volume sits within the £10k–£20k bracket, maintaining this as the dominant price range for combustion engine vehicles. The £0–£10k segment continues to offer entry-level affordability, representing nearly 30% of the market.
Dealer Activity by Inventory Volume – ICE
Dealer spread remained consistent with previous months, pointing to stable operational dynamics.
- 0–100 cars: 9488 dealers
- 101–250: 780
- 251–500: 152
- 501–1000: 74
- 1000+: 76
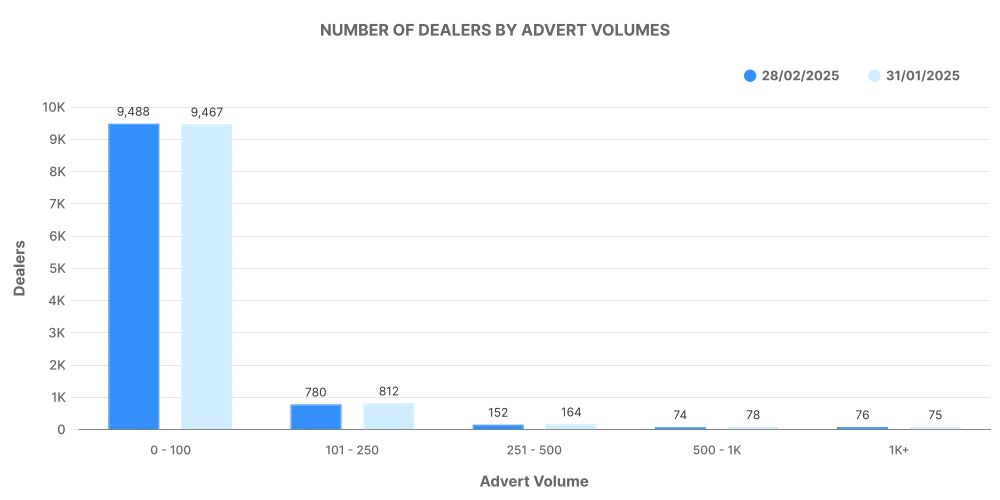
Most retailers still operate on a lean stock model. This long-tail structure underlines the UK’s fragmented used car sector, with thousands of small to mid-sized players participating across regions.
Top 100 ICE Dealers
The top 100 dealerships listed 270,285 vehicles, accounting for 36.4% of all ICE listings. Their average price came in at £21,937, around 19% above the overall ICE average.
- Average days on market (Top 100): 54 days
- Price increases recorded: 71,796
- Price decreases recorded: 208,759
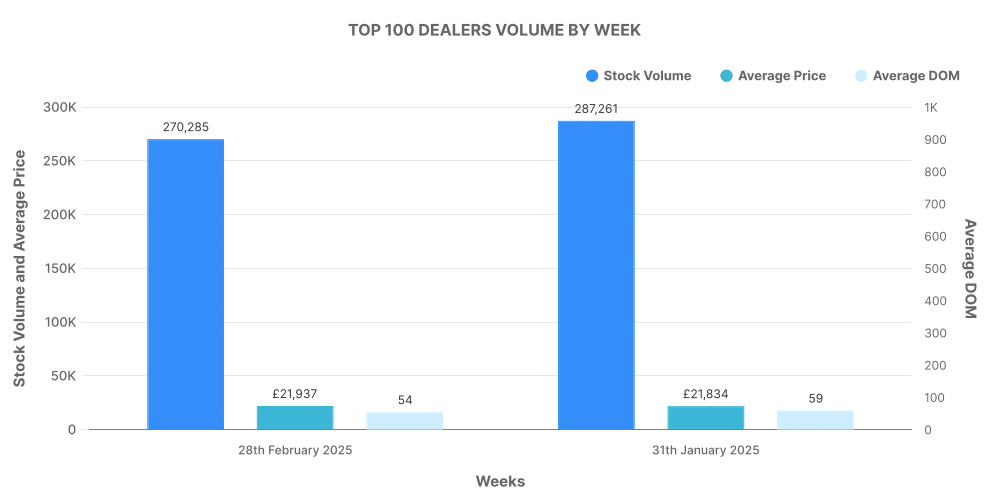
These businesses continued to operate more dynamically, frequently adjusting prices. Interestingly, over three times as many price reductions were recorded compared to price hikes, suggesting margin compression or reactive pricing in a competitive segment.
Electric Used Car Market – February 2025
EVs continued to build momentum, with 111,890 listings across 4,798 dealers. This marks a small increase in volume and another record month for electric in terms of market share.
- Average days on market: 67
- Average listed price: £26,180
The electric used car market now represents 15.06% of all UK used car listings, up from 14.41% in January. With more stock and more rooftops carrying EV inventory, growth appears gradual but sustained.
Breakdown of Electric Listings by Price Bands
EV pricing remained concentrated in the £10k–£30k range, offering accessibility while still reflecting higher average pricing compared to ICE vehicles.
- £0 – £10,000: 4,368 listings
- £10,000 – £20,000: 42,172 listings
- £20,000 – £30,000: 36,269 listings
- £30,000 – £40,000: 15,036 listings
- £40,000 – £50,000: 6,161 listings
- £50,000+: 6,124 listings
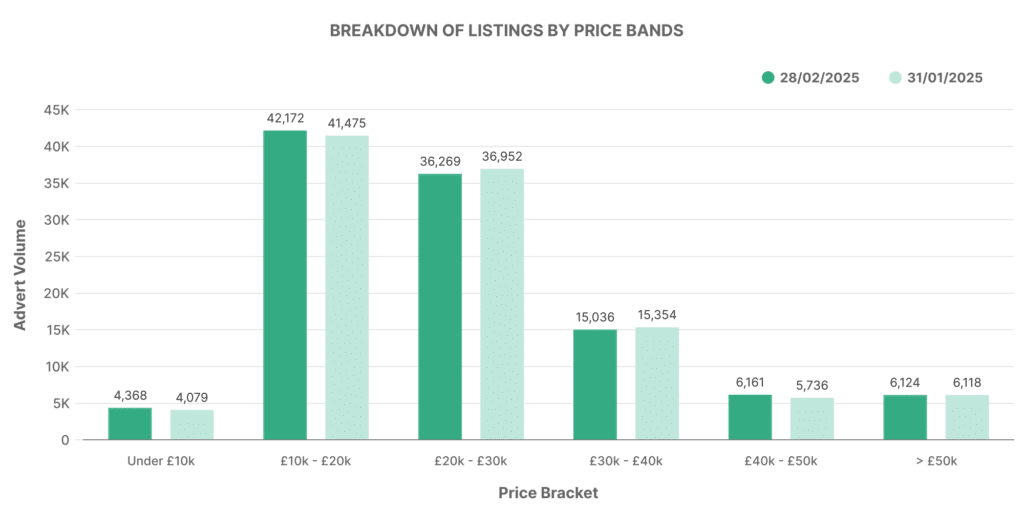
Nearly 70% of EV listings fall between £10k–£30k, reflecting the maturing of the second-hand electric vehicle market. With more ex-fleet and ex-lease models entering the market, pricing is gradually becoming more accessible.
Dealer Activity by Inventory Volume – EV
EV dealer activity remains skewed towards those managing smaller inventories, but high-volume EV dealers are slowly increasing.
- 0–100 cars: 4530 dealers
- 101–250: 94
- 251–500: 30
- 501–1000: 21
- 1000+: 17
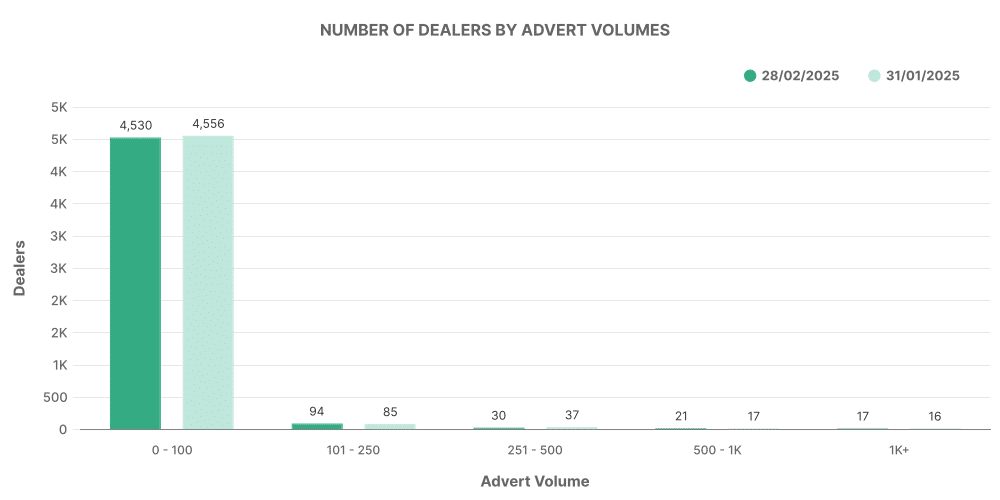
The bulk of EV dealers continue to operate within the sub-100 vehicle range. Only 3% of rooftops handle more than 250 EVs, which is reflective of infrastructure, stocking costs, and relative market youth.
Top 100 EV Dealers
The top 100 EV dealers accounted for 68,780 vehicles, slightly more than 61% of all electric listings — showing higher consolidation compared to the ICE market.
- Average days on market (Top 100): 55
- Average price (Top 100): £26,536
- Price increases recorded: 17,571
- Price decreases recorded: 65,198
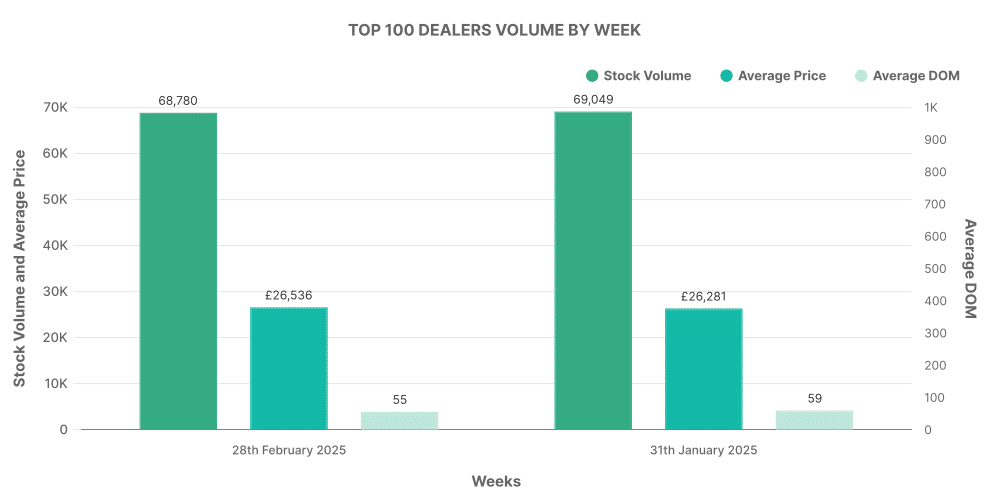
Compared to ICE, EVs show tighter pricing behaviour, with fewer price cuts among the top sellers. The narrower band of movement may indicate more consistent demand across price points or stronger brand/model confidence.
Top 10 EV Models by Advert Volume
These ten models accounted for over 30,000 of the February EV listings. Toyota continues to dominate across both hybrids and full electric models.
- Toyota Yaris – 4,581
- KIA Niro – 3,898
- Toyota C-HR – 3,581
- Tesla Model 3 – 3,332
- Toyota Corolla – 3,267
- BMW 3 Series – 2,527
- Ford Kuga – 2,349
- Hyundai Kona – 2,181
- Hyundai Tucson – 1,944
- Nissan Leaf – 1,932
With Tesla remaining popular in the £30k+ bracket and models like the Nissan Leaf and Hyundai Kona offering strong volumes in the mid-range, the electric used car market continues to diversify.
Comparing ICE and EV Markets – February 2025
| Metric | ICE | EV |
|---|---|---|
| Total Listings | 742,912 | 111,890 |
| Share of Total Market | 84.94% | 15.06% |
| Avg Price | £18,399 | £26,180 |
| Avg DOM | 85 days | 67 days |
| Top 100 Dealer Share | 36.4% | 61.5% |
The used electric car market now accounts for more than 1 in every 7 used vehicle listings in the UK. Average price is £7,781 higher for EVs compared to ICE cars. EVs also sell faster, with an average of 18 fewer days on the market. These performance differentials, along with growing stock and dealer involvement, signal a sustained trajectory.
What This Means for UK Automotive Businesses
For dealers, insurers, finance firms and vehicle investment businesses, understanding these UK car price trends and volume dynamics is vital. The electric used car market is maturing, but fragmentation in supply and pricing means there’s still room to gain a competitive edge.
From retail pricing strategy to stocking decisions and residual value forecasting, having full visibility over historic and real-time data is key.
Marketcheck UK provides automotive market insights from every current and historical used car advert listing in the country — from mainstream dealers to niche classifieds. If you’re looking to identify opportunities in the EV sector or want accurate price benchmarks across combustion and electric stock, we offer tailored data feeds, APIs and reporting tools that can support your business strategy.
Previous month: January 2025
