In a dynamic landscape where every penny and second counts, understanding the data of the UK’s used car market is not just beneficial—it’s essential for automotive dealers aiming to thrive. This week’s analysis sheds light on the latest trends and insights, guiding you through the intricacies of the market with the precision and clarity you deserve.
Unpacking the Numbers: A Detailed Overview
The latest data from the week ending on 16th March 2024 reveals significant movements and trends in the UK’s used car market. With a total of 10,374 dealers and 14,273 rooftops participating, the market boasted an impressive 881,638 listings. The average days on market (DOM) remained steady at 84, reflecting a consistent pace in sales velocity. Meanwhile, the average price slightly adjusted to £17,806, indicating subtle shifts in market dynamics.
Breaking Down Listings by Price Bands
The distribution of listings across various price bands offers a nuanced view of consumer preferences and market health. The data shows a notable volume of 184,465 listings in the £0-10K band, followed closely by 229,520 in the £10-20K range. These figures suggest a robust demand for more affordable vehicles, a key insight for dealers looking to optimise their inventory.
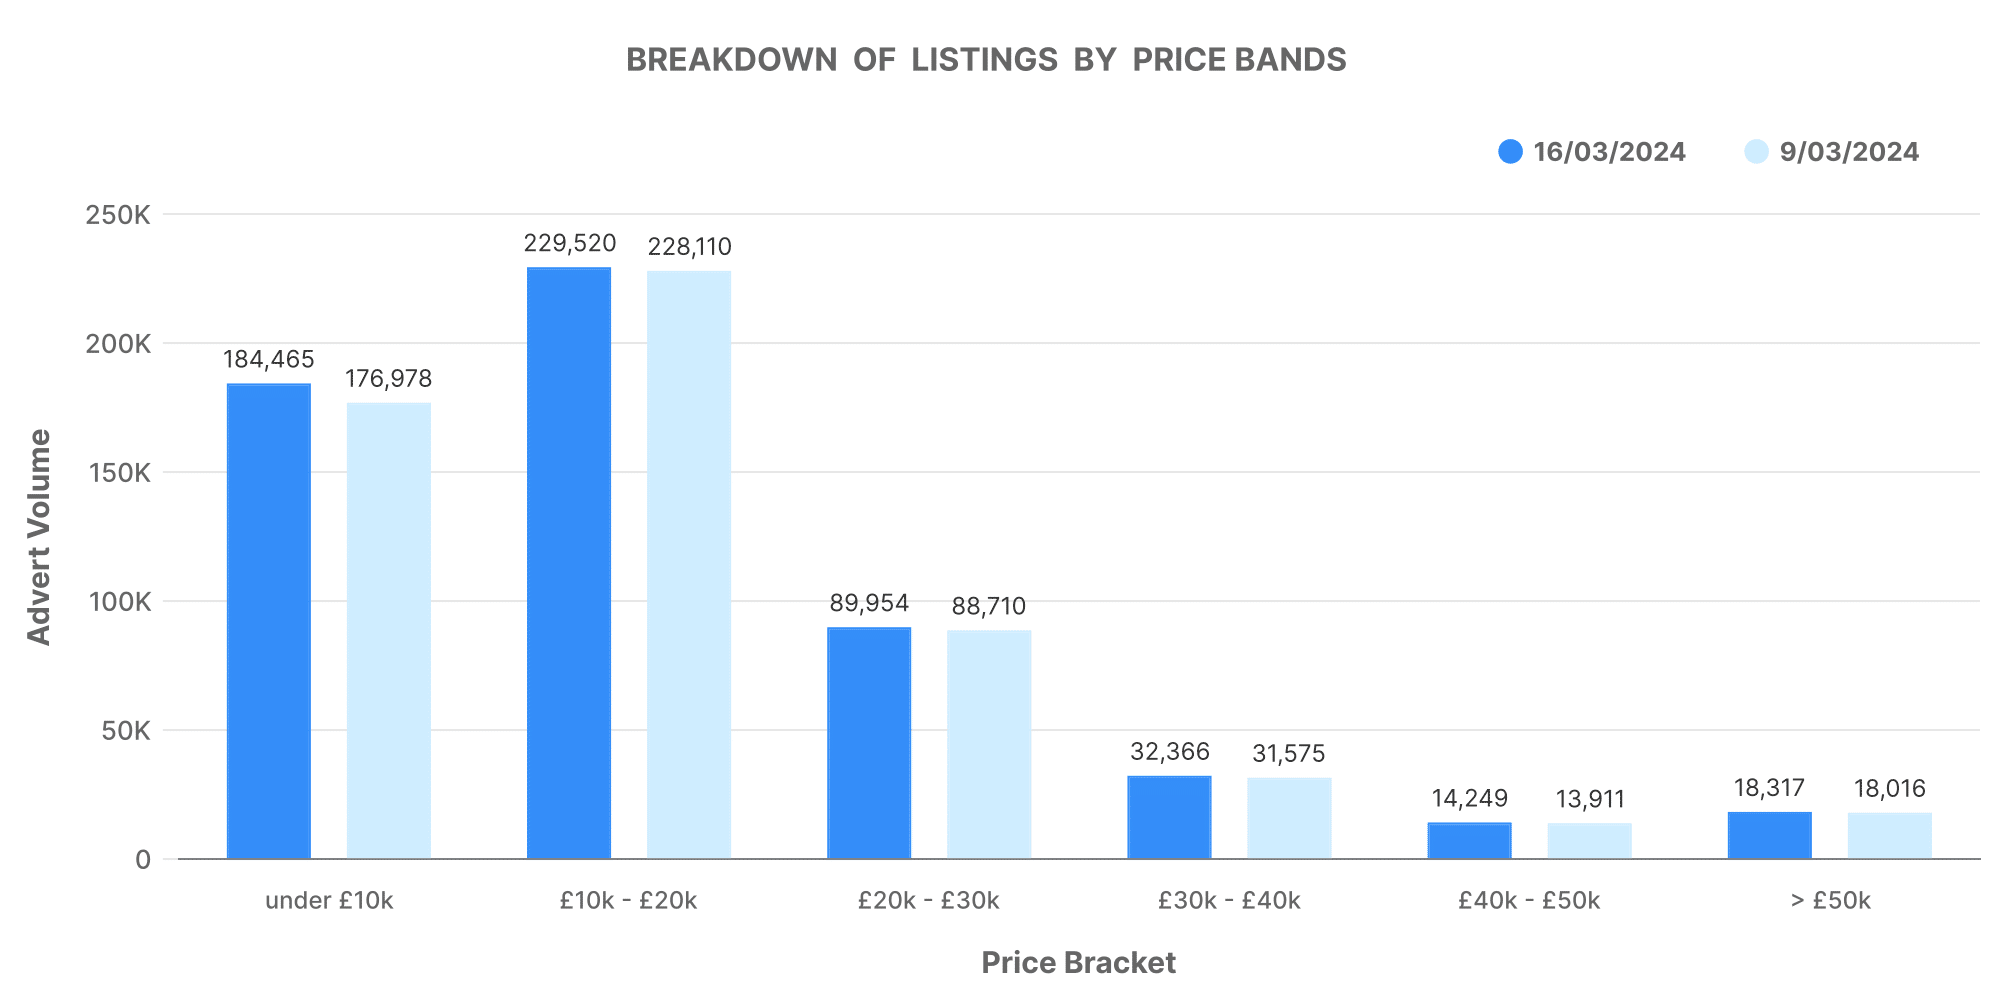
The higher price bands, while smaller in volume, provide a glimpse into the premium segment’s performance. With 9,523 listings above £50K, there’s a clear indication of a niche yet significant market for luxury vehicles.
Dealer Dynamics: Advert Volumes and Market Share
The ‘Number of Dealers by Advert Volumes’ graph illustrates the competitive landscape, highlighting how dealers are positioned in terms of inventory size. A closer look at the top 100 dealers reveals they hold a substantial share of the market, with a combined stock volume of 204,003 vehicles. Their average DOM sits at 54 days, and the average price at £21,158, underscoring their focus on a faster turnover and potentially higher-value vehicles.
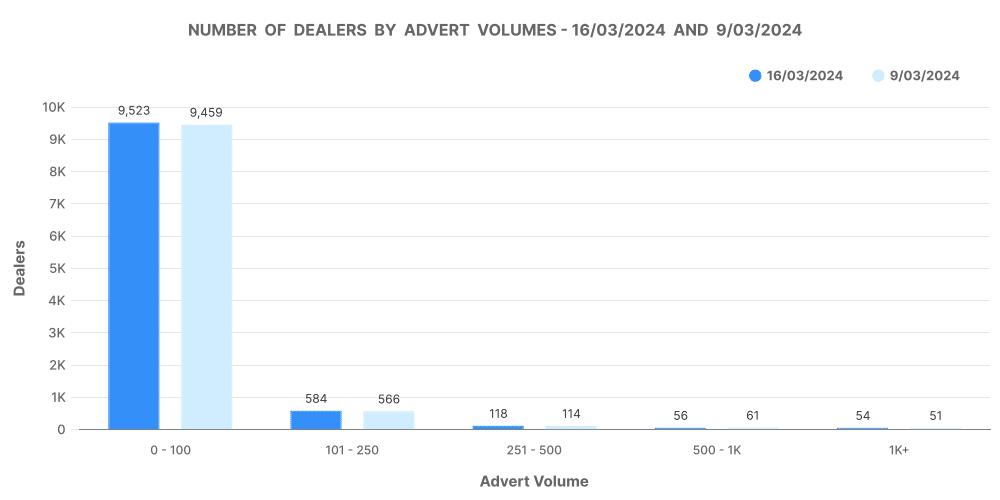
Conversely, dealers outside the top 100 showcase a different strategy, with a higher average DOM of 100 days and a lower average price of £15,954, suggesting a focus on longer-term holdings and possibly more budget-friendly options.

Marketcheck UK: Your Data-Driven Partner
By leveraging the depth and breadth of Marketcheck UK’s data, you’re not just navigating the used car market—you’re mastering it, armed with the insights needed to drive your success. Whether you’re adjusting pricing, fine-tuning your inventory, or seeking new opportunities, the data you need is at your fingertips, ready to transform challenges into opportunities.
Conclusion
In conclusion, the market analysis data between the two periods indicates that the market is dynamic and constantly evolving. Dealers increase in numbers and adjust their advert quotes to stay competitive. Moreover, the consistent DoM average suggests a stable market. Overall, the data provides valuable insights for both existing and prospective market participants.