Insights into UK Car Price Trends
The latest data from Marketcheck UK highlights some significant shifts in the used car market. The number of active dealers has slightly increased from 10,336 to 10,421 between the weeks starting 6th April 2024 and 13th April 2024. Similarly, the number of listings has grown from 844,216 to 861,903, suggesting a robust increase in market activity. This rise in listings is matched by a small uptick in average days on market (DOM), from 81 to 84 days, which could indicate a slight slowdown in sales velocity.
Breakdown of Listings by Price Bands
When we delve into the price segmentation of the market, there’s a noticeable pattern:
- Listings priced between £0-10K have slightly decreased, pointing to a potential reduction in the availability of lower-priced vehicles.
- The mid-range markets, notably in the £10-20K and £20-30K brackets, remain relatively stable, indicating ongoing demand in these segments.
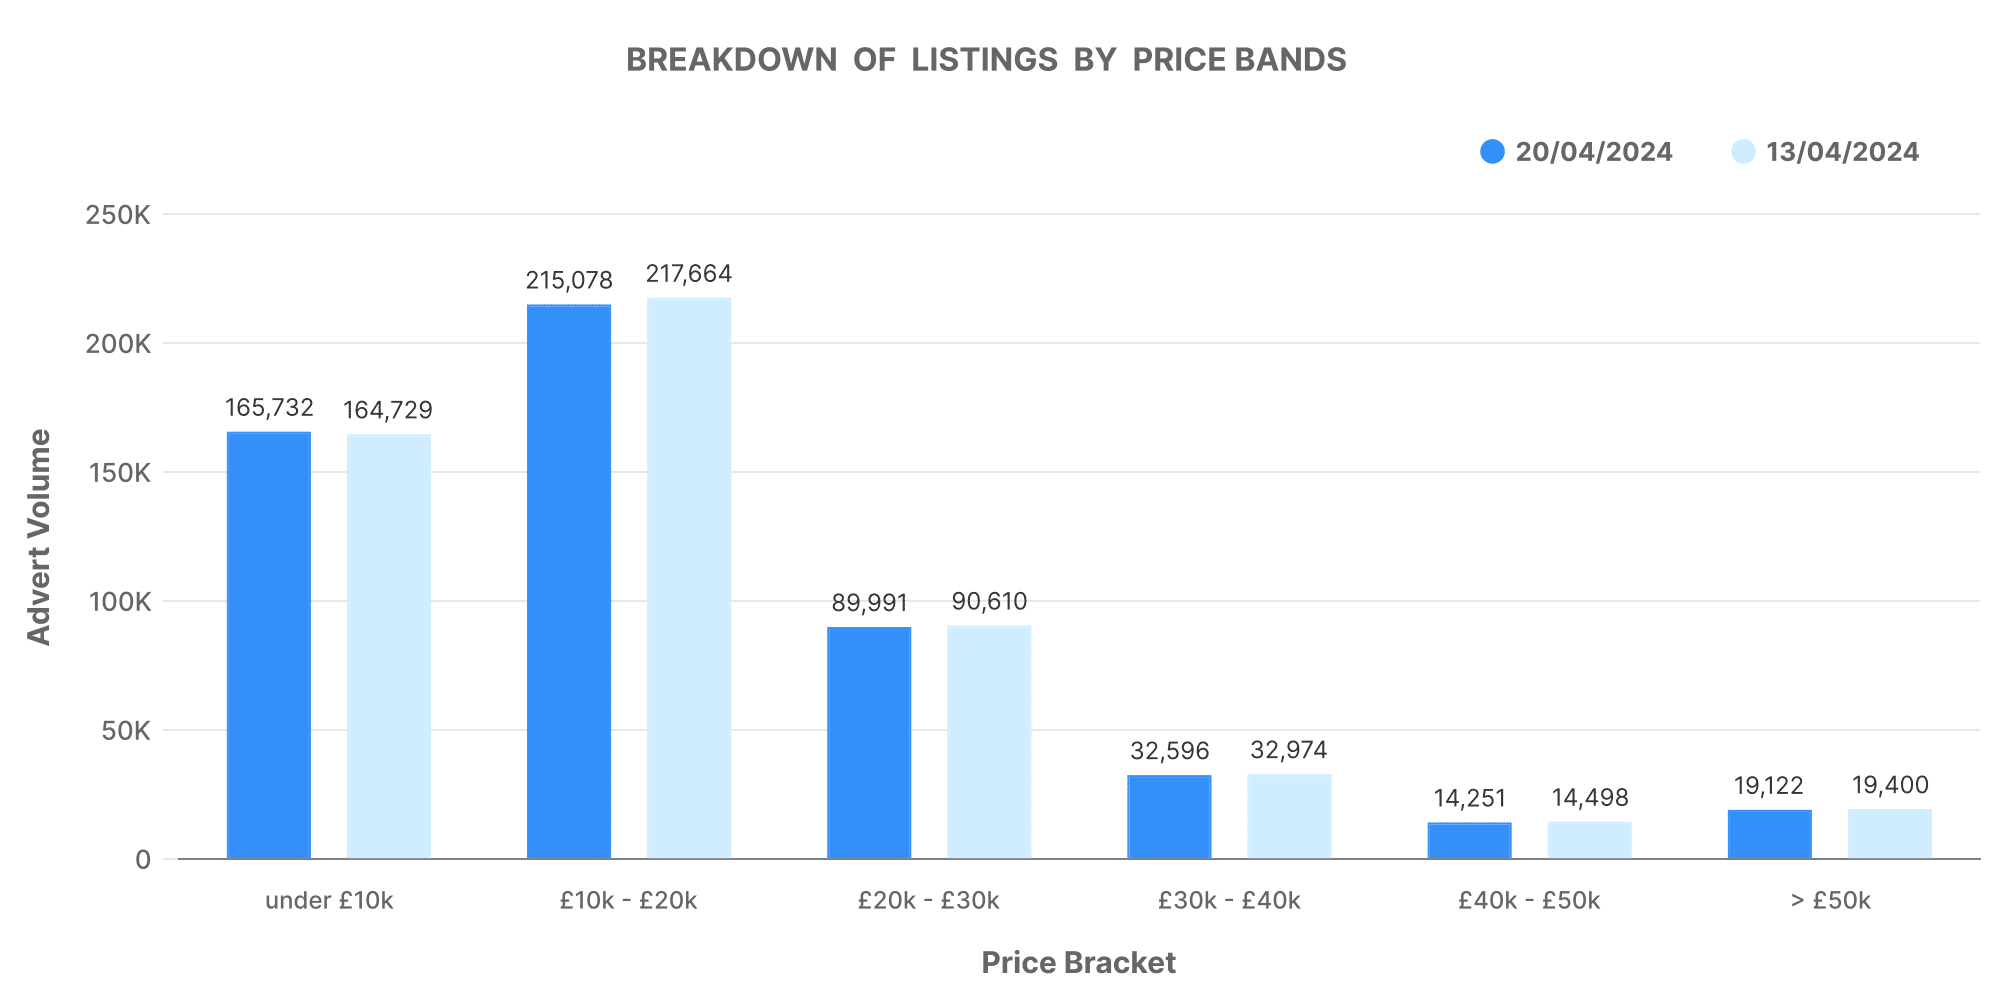
The consistency in these mid-range price bands suggests a steady interest from buyers, potentially those looking to upgrade from their initial, lower-cost purchases.
Analysis of Top 100 Dealers by Volume
The top 100 dealers by stock volume have shown an impressive ability to maintain a lower average DOM of 47 days in the week starting 6th April, which slightly increased to 49 days in the following week. This metric is crucial as it underlines the efficiency and sales effectiveness of top performers in the used car market.

Price Dynamics
An intriguing aspect is the price adjustment behaviour among the top 100 dealers:
- There were 10,287 price increases and 57,257 price decreases in the initial week, which shifted to 9,690 increases and 64,010 decreases the following week. This suggests a strategic adjustment to pricing, possibly in response to market feedback and inventory turnover goals.
Number of Dealers by Advert Volumes
The dealer landscape is becoming more competitive, with slight increases across various inventory volume bands:
- Dealers holding inventory volumes between 0-100 units have increased, indicating a growth in smaller dealers or those perhaps new to the market.

This trend might reflect a diversifying used car market where smaller players are finding their footing and beginning to challenge larger, more established dealers.
How Marketcheck UK Supports Your Business
Marketcheck UK offers invaluable resources to car dealerships:
- Comprehensive Data Feeds: Stay updated with real-time changes in the market.
- API Access: Integrate live data directly with your systems for seamless operations.
- Analytical Tools: Leverage detailed insights from our data to optimise your pricing and inventory strategies.