The landscape of the UK’s used car market is ever-evolving, with fluctuations in pricing, dealer activity, and market trends. Marketcheck UK stands at the forefront of this dynamic industry, providing in-depth insights and data analysis that empower automotive dealers to make informed decisions. This week’s analysis delves into the latest trends and statistics from the UK’s used car market, spotlighting the crucial data points that can guide dealers in strategising their inventory and pricing models.
Insight into Price Trends and Dealer Activity
One of the standout insights from this week’s data is the subtle shift in average price and dealer activity. With an average price uptick from £18,055 to £18,261, the market indicates a slight increase in value across the board. This change, coupled with an increase in total dealers from 10,378 to 10,407, suggests a competitive atmosphere where dealers are vying for the best stock at the most advantageous prices.
Analysing the Price Band Volumes
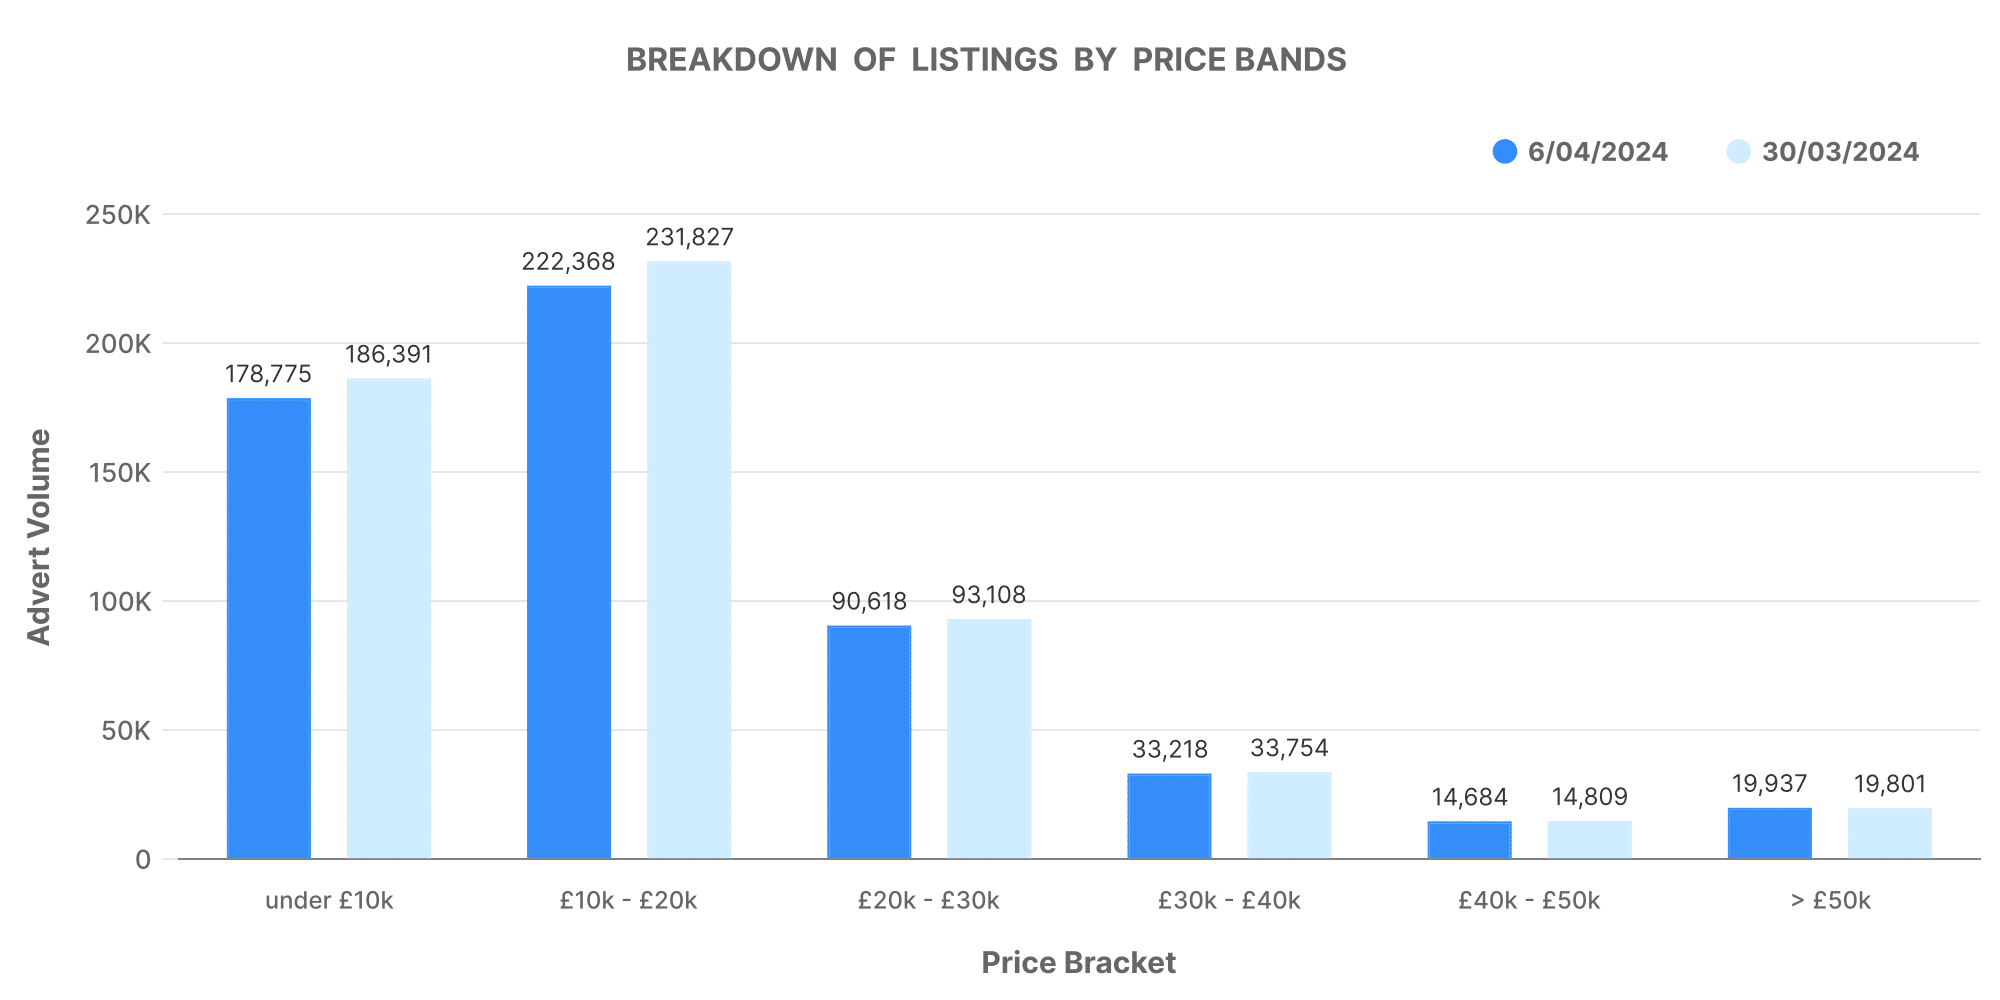
The data reveals a nuanced landscape of price band volumes, with the majority of listings falling within the £0-20K range. Notably, there’s a slight decrease in the volume of cars priced between £10K and £20K, which could indicate a shift in consumer interest or dealer inventory strategies. Understanding these trends is vital for dealers to align their stock with market demand, potentially increasing their turnover rate and profitability.
Dealer Inventory Volumes: A Closer Look
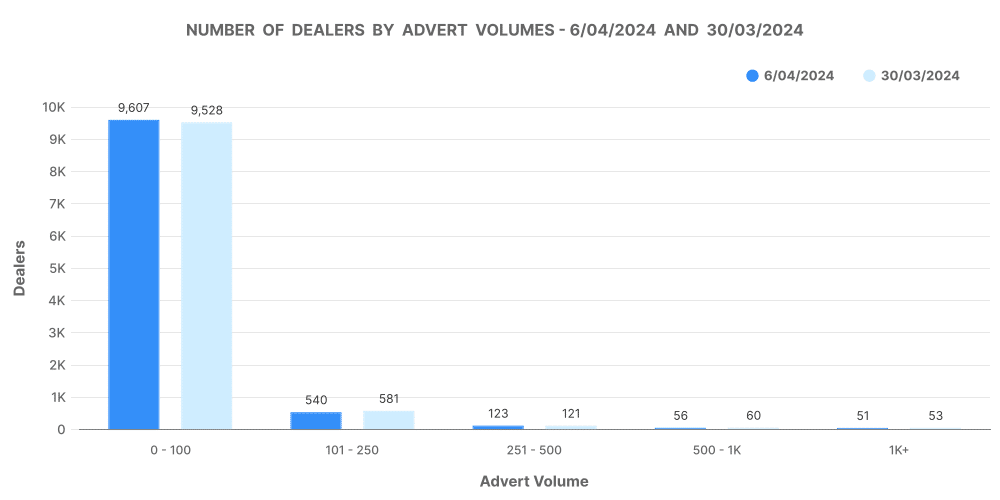
The inventory volume data insights offer a window into the operational scale of car dealers across the UK. With a notable presence in the 0-100 and 101-250 inventory volume bands, it’s clear that a substantial portion of dealers operate with smaller, more curated inventories. This strategy might be a response to market demand, allowing dealers to be agile and responsive to the fast-paced changes in car preferences and pricing.
Top 100 Dealers vs The Rest: A Comparative Analysis
The distinction between the top 100 dealers and the rest is striking, particularly in terms of stock volume and average days on market (DOM). The top 100 dealers boast a lower average DOM, indicating a faster turnover and potentially more efficient pricing strategies. This efficiency is a critical metric for all dealers, as a lower DOM not only reflects healthy demand but also indicates effective inventory and pricing management.

Price Adjustments: Responding to Market Dynamics
Price adjustments are a key indicator of market responsiveness. The top 100 dealers have shown a higher number of price increases compared to decreases, suggesting a bullish outlook on the market’s potential. Conversely, the broader market shows a more cautious approach, with fewer price increases and more decreases. This dichotomy underscores the importance of data-driven strategies, enabling dealers to adapt to market trends proactively.
Marketcheck UK: Your Partner in Market Analysis
Marketcheck UK’s data tools offer unparalleled insights into the UK’s used car market, equipping dealers with the knowledge to optimise their inventory and pricing strategies. By analysing trends in price bands, inventory volumes, and dealer activities, automotive dealers can stay ahead in the competitive marketplace.
Conclusion
In conclusion, the period studied saw a stable total number of rooftops but an increase in the total number of dealers. Despite a slight decline in total advertisements and most price band volumes (except for the highest tier), pricing notably became more stable and the average listing price rose. The data analysis also hints towards a slower market from a DoM standpoint. Overall, the insights suggest potential opportunities for dealers, especially smaller ones, enabling more strategic decision-making.