In the ever-evolving world of the automotive industry, electric vehicles (EVs) have taken centre stage, reshaping market dynamics and consumer preferences in the UK. This week’s data sheds light on the current state of the electric car market, offering valuable insights for automotive dealers looking to capitalise on these trends.
Insights into Electric Car Market Dynamics
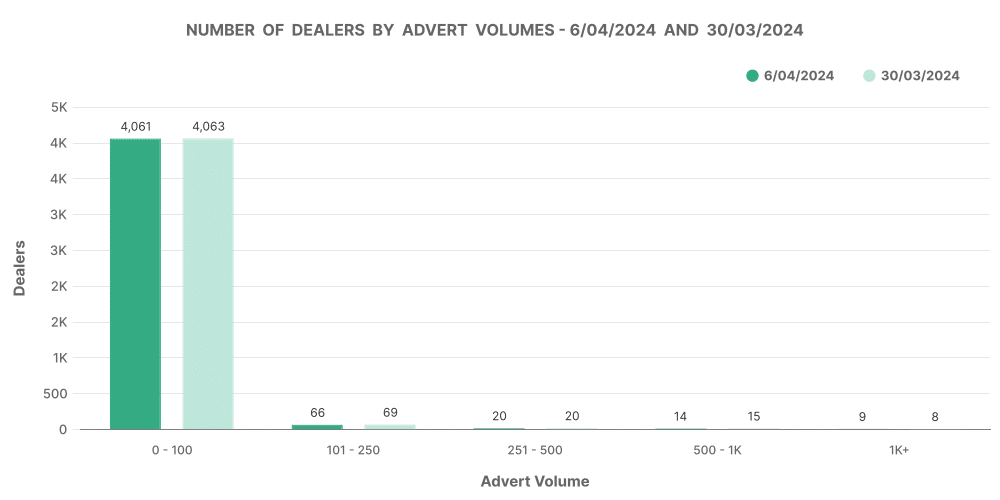
The latest data insights reveal a nuanced picture of the electric car landscape in the UK. With a total of 4,274 dealers hosting 7,402 electric rooftops, the market is vibrant and expansive. The total number of listings for electric vehicles stands at 120,005 for the week ending 6th April 2024, indicating a robust inventory for potential buyers.
The average days on market (DOM) for electric vehicles is 70, a metric that dealers closely monitor to gauge market demand and pricing strategies. Interestingly, the average price of electric cars has seen a slight uptick to £28,295, reflecting the growing consumer interest and the premium value attached to EVs.
Breakdown by Price Bands
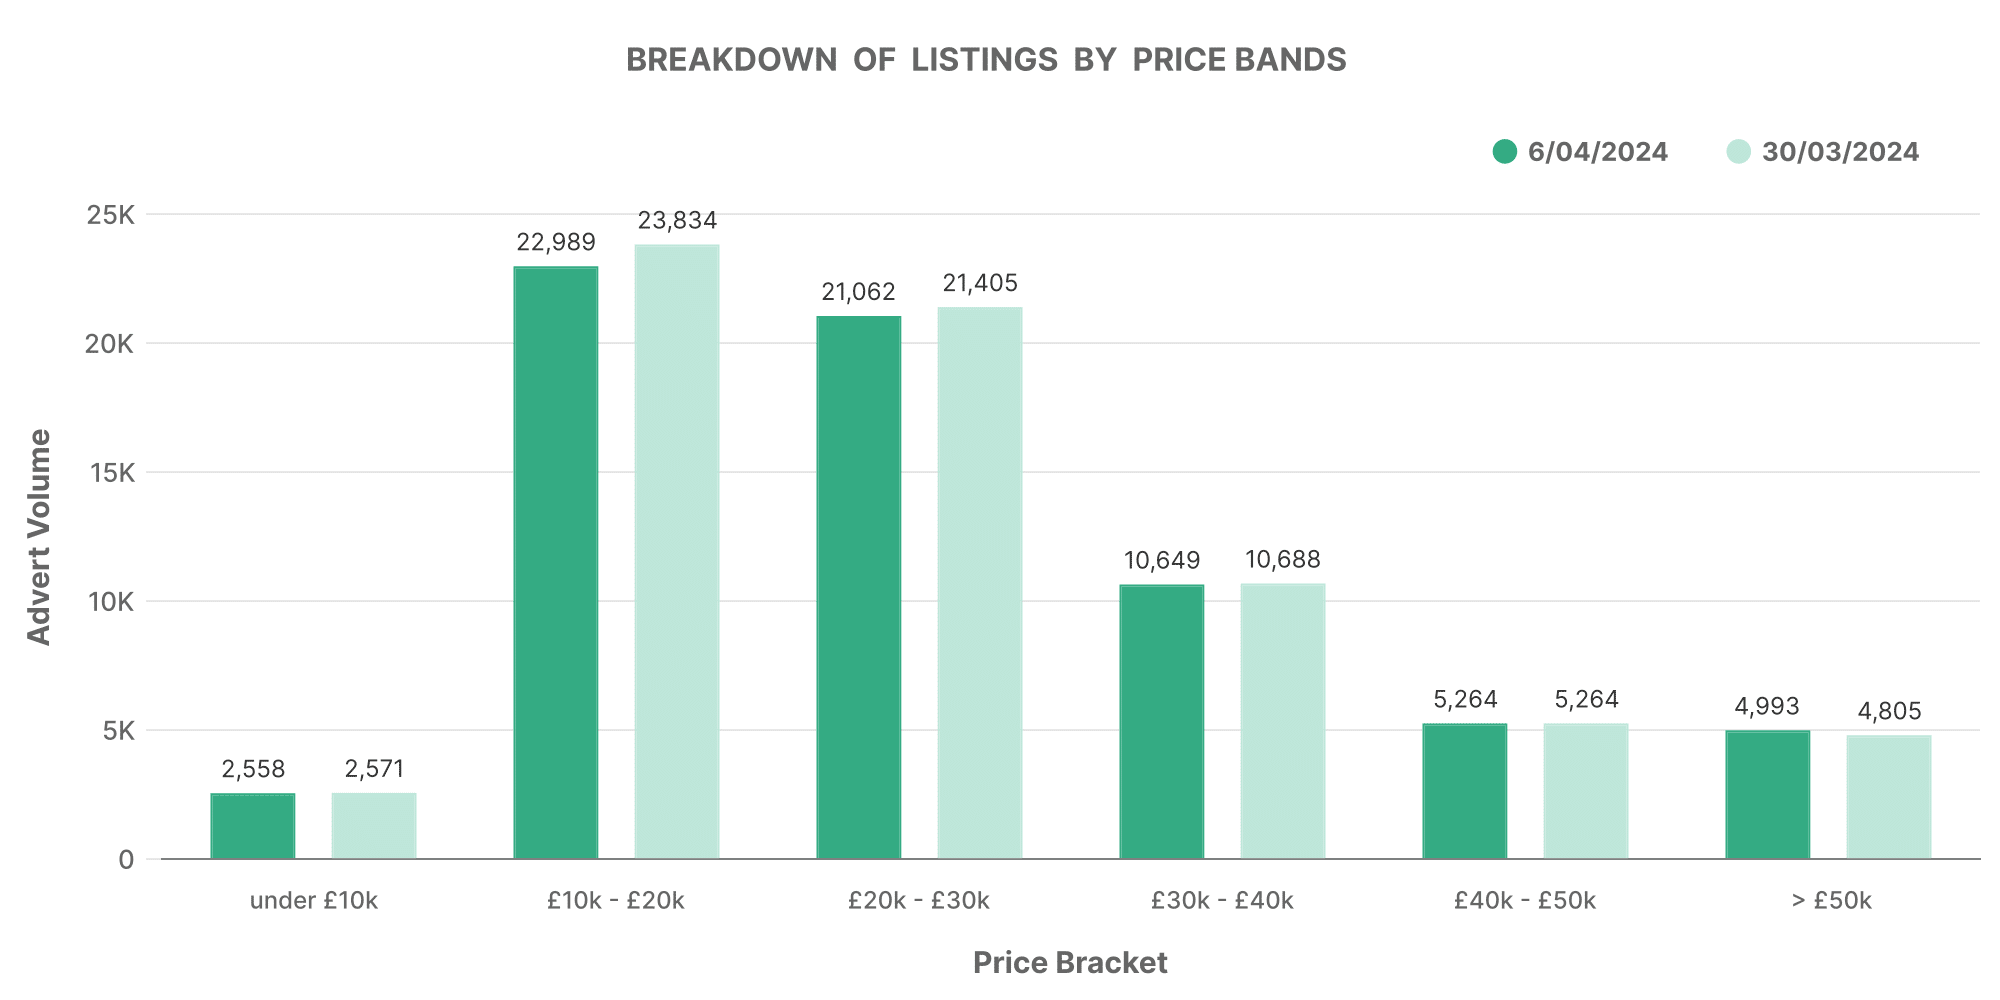
The electric car market exhibits a diverse range of options across various price bands. The data reveals:
- A significant volume of 25,589 units in the £0-£10K range, suggesting a healthy market for entry-level electric vehicles.
- The £10K-£20K and £20K-£30K price bands also show substantial volumes, with 21,062 and 10,649 units respectively, indicating a strong middle market.
- Premium segments (£30K-£50K) are not far behind, with notable listings, demonstrating the market’s appetite for higher-end electric vehicles.
Dealer Analysis: Top 100 vs. The Rest
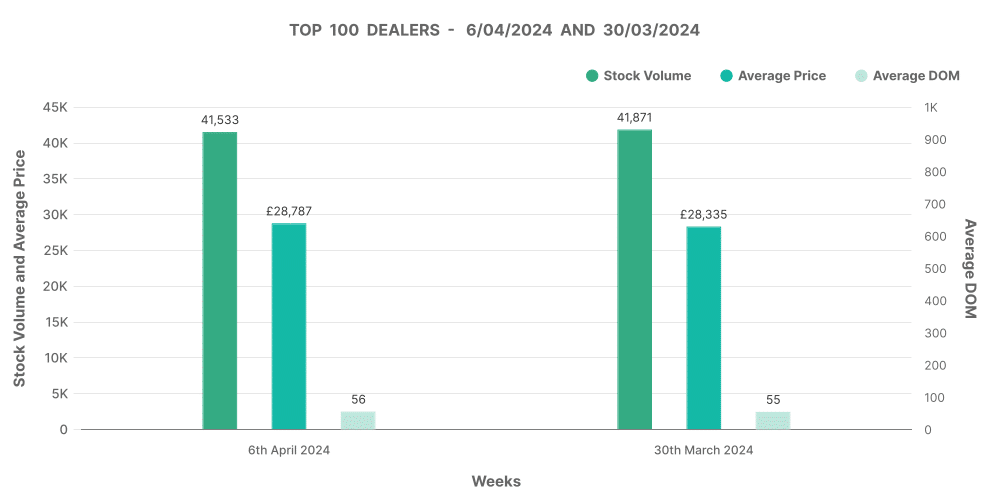
The top 100 dealers by volume hold a pivotal position in the electric car market, with a stock volume of 41,871 units. These dealers also exhibit a quicker turnaround with an average DOM of 56 days, suggesting a more aggressive pricing or marketing strategy compared to other dealers.
Conversely, dealers outside the top 100 show a slightly higher DOM of 90 days, possibly indicating a different market approach or customer base. This distinction underscores the varied strategies and market positions within the UK’s electric car dealership landscape.
Marketcheck UK’s Relevance
For automotive dealers, understanding these trends and nuances is crucial for strategic decision-making. Marketcheck UK offers an unparalleled depth of data, providing a granular view of the market that dealers can leverage to optimise their inventory, pricing, and sales strategies. Whether you’re looking to stock up on high-demand models or adjust pricing to meet market dynamics, Marketcheck UK’s insights can guide your decisions.
Strategic Implications for Dealers
- Inventory Management: Align your inventory with market demand. Focus on stocking electric vehicles in price bands with higher sales volumes and quicker turnover.
- Pricing Strategies: Utilise the average price data and DOM metrics to refine your pricing strategies, ensuring they resonate with current market conditions.
- Market Positioning: Whether you’re among the top 100 dealers or not, understanding your position relative to market leaders can inform your competitive strategy.
Conclusion
The electric car market in the UK is vibrant, diverse, and full of opportunities for dealerships willing to adapt and respond to market signals. The analysis indicates a steady market for electric cars with slight variations in advert numbers, listing distribution, and dealer volumes. The increase in DoM suggests a slightly slowed market dynamic.