Current Market Dynamics
The electric car market is showing a distinct trend in dealership engagement and consumer interest. As of the week ending on 20th April 2024, the total number of dealers stood at 4,203 with 7,371 rooftops involved in the electric vehicle market. A noteworthy increase in total listings to 130,018 from the previous week’s 125,630 indicates a growing inventory and possibly, rising consumer demand.
The average days on market (DOM) for electric vehicles slightly increased from 68 to 70 days. While this suggests a marginal slowdown in sales velocity, the consistent average price around £28,252 demonstrates a stable market valuation for electric vehicles.
Price Band Analysis
Understanding the price segmentation within the electric car market reveals strategic insights. The volume of electric cars listed under different price bands shows a higher concentration in the £10K to £20K and £20K to £30K ranges, with 21,157 and 10,863 units respectively. This indicates a robust demand in the mid-price segment, which could be an attractive entry point for dealers looking to stock up on popular models.
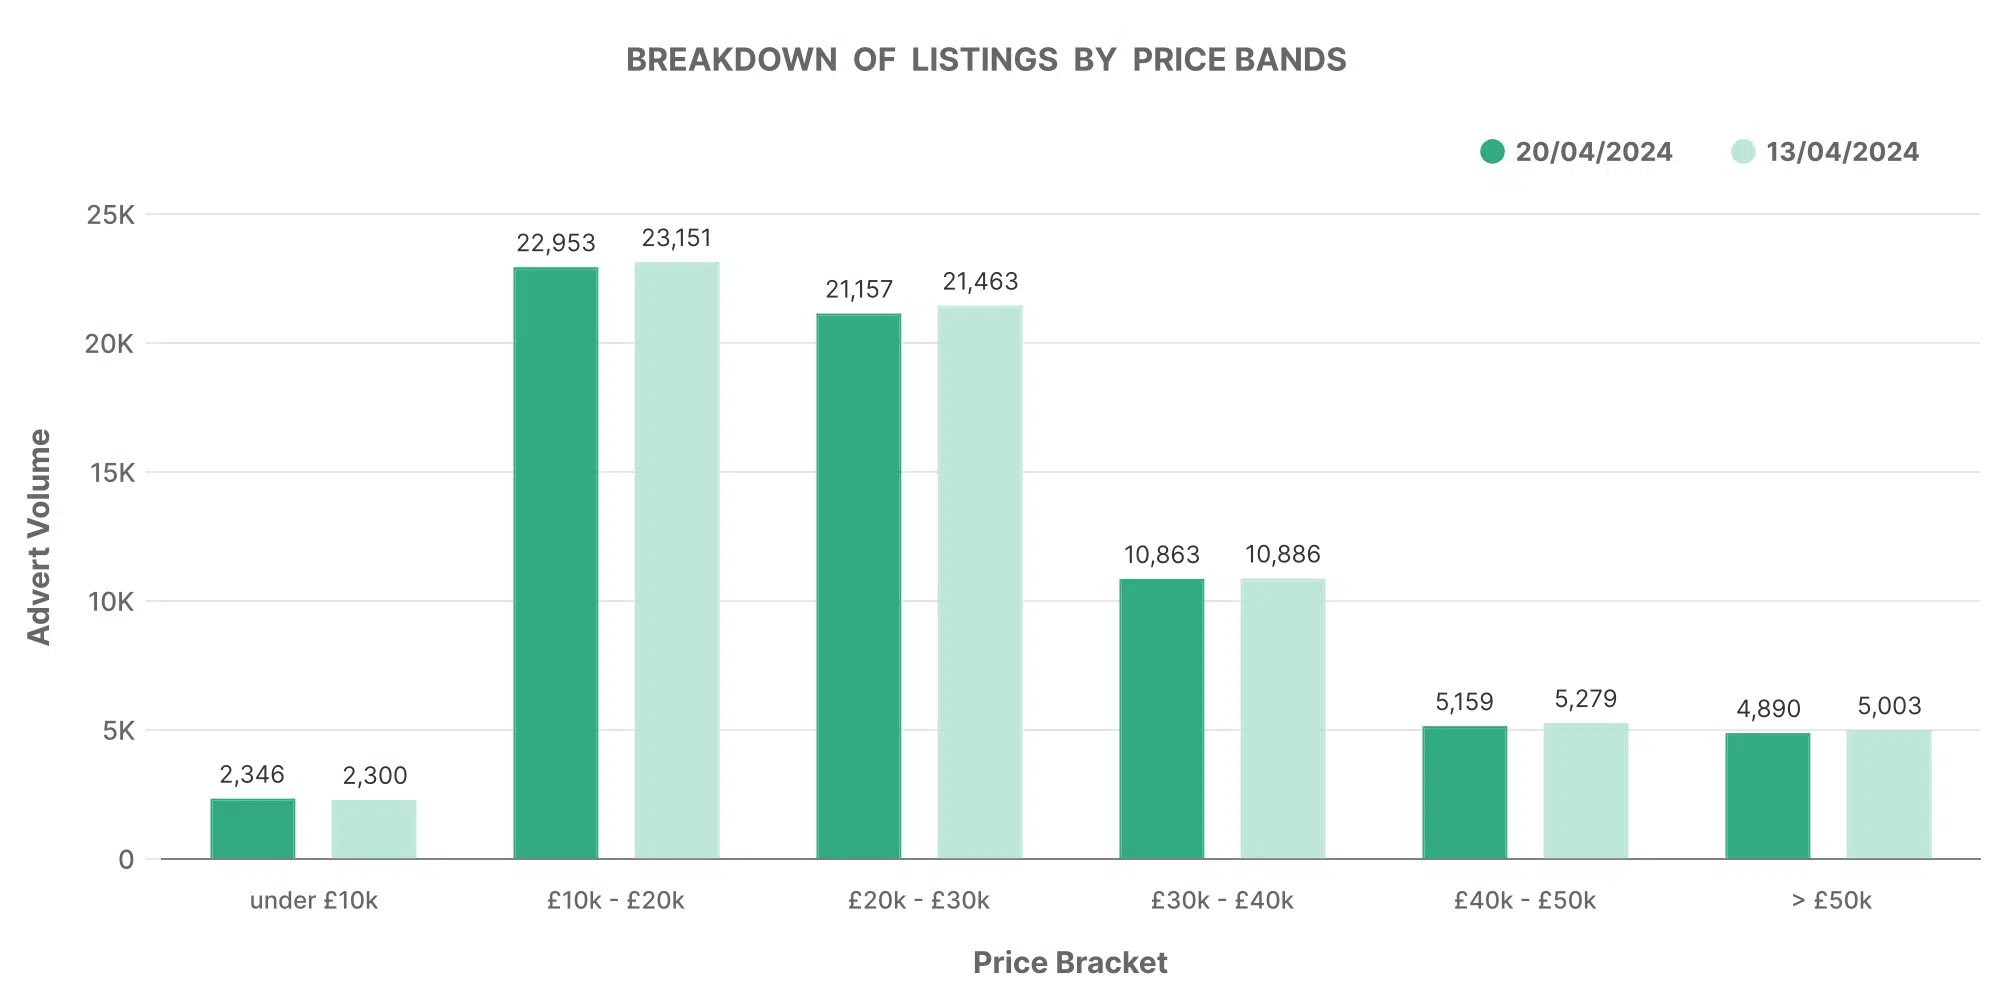
Interestingly, the premium segment (£50K and above) holds a substantial inventory with 3,989 units, highlighting a significant niche market that caters to high-end consumers.
Dealer Performance by Volume
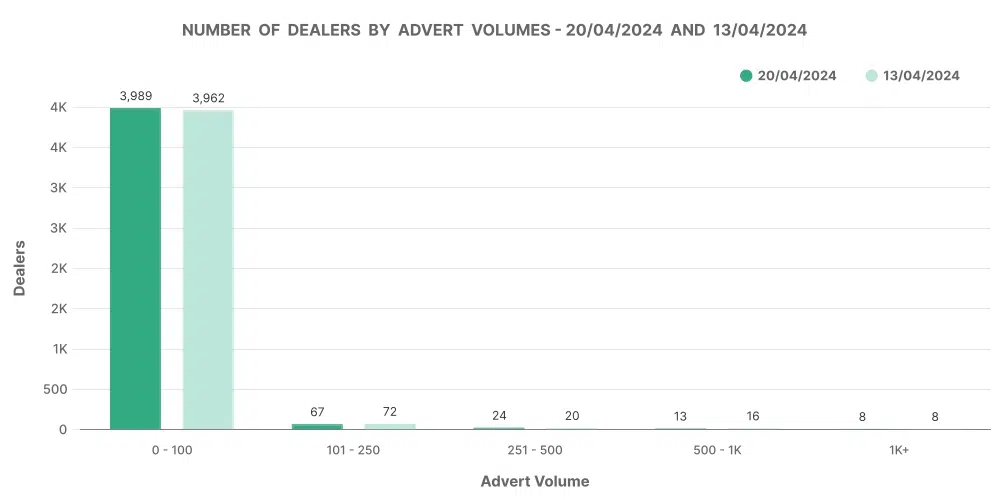
Focusing on electric inventory volumes, the majority of dealers hold between 0 to 100 units, suggesting that smaller operations still dominate the EV market. However, a small segment of dealers handling over 1,000 units underscores the presence of major players who are likely driving the competitive dynamics within this sector.
Top 100 Dealers: A Closer Look
Inventory and Sales Strategies
The top 100 dealers are managing to turn over their stock more quickly than the market average, with an average DOM of 56 days compared to the overall average of 70 days. This efficiency could be attributed to aggressive pricing strategies and a keen understanding of market demands.
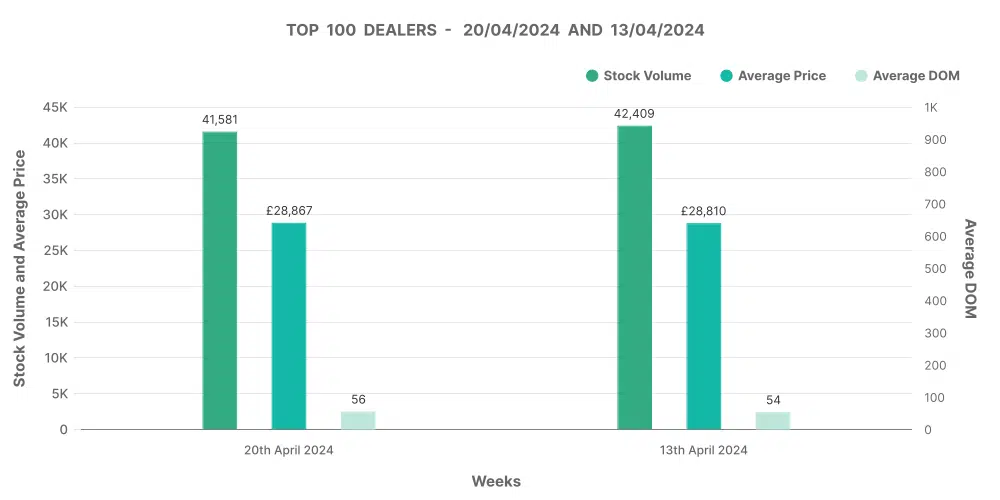
Their average price stands at £28,867, slightly above the market norm, which might indicate better vehicle conditions or a focus on higher-spec models. Notably, these top dealers are experiencing more frequent price decreases (19,874 instances) than increases (1,955 instances), which could be part of dynamic pricing strategies to attract buyers in a competitive market.
Stock Trends and Insights
The analysis of top 100 dealers also reveals that the popularity of specific makes and models, such as the Toyota Yaris, persists. This consistency helps predict future trends and stock requirements.
The Broader Electric Car Market
Performance of Dealers Outside the Top 100
Dealers not within the top 100 are facing longer sales periods, with an average DOM of 90 days. Their average price point is lower at £27,276, reflecting perhaps a different stock profile or less aggressive marketing strategies.
These dealers also show fewer price adjustments, which may indicate less flexibility in their sales tactics or a different customer demographic.
Marketcheck UK’s Role in Your Strategy
Understanding these trends is just the beginning. Marketcheck UK offers tailored solutions that help you harness this data through advanced API’s, real-time data feeds, and comprehensive analysis tools. Whether you’re looking to refine your inventory based on fast-moving price bands or aiming to benchmark your performance against the top 100 dealers, our tools are designed to empower your decision-making.
How We Can Help
- Real-time Pricing Insights: Stay updated with the latest electric car market price trends and adjust your sales strategy dynamically.
- Inventory Analysis Tools: Determine which models and price bands are selling fastest in your region to optimise your stock.
- Competitive Benchmarking: See how you stack up against the top performers and find your competitive edge.