Overview of Market Dynamics
The total number of active car dealerships in the UK has slightly increased from 10,336 to 10,421 over the last week, accompanied by a growth in total listings from 844,216 to 861,903. This expansion reflects a vibrant market with increasing opportunities. However, the average days on market (DOM) for listings have risen from 81 to 84 days, suggesting a slight slowdown in sales velocity.
Price Trends and Consumer Preferences
The average price of listed vehicles remained relatively stable at around £18,490, showing a small decrease from the previous week’s average of £18,544. This stability in pricing, despite an increase in listings, indicates sustained demand across price bands. Notably, the volume in the lower price bands (0-10K and 10-20K) remains significant, pointing to a continued consumer preference for affordable used cars.
Breakdown of Listings by Price Bands
The insights indicate diverse pricing strategies among car market dealers:
- Vehicles priced between £0-10K and £10-20K still dominate the market, comprising the majority of listings.
- Higher-priced segments (£30-40K and above) show lower volume but are crucial for dealers specialising in premium models.
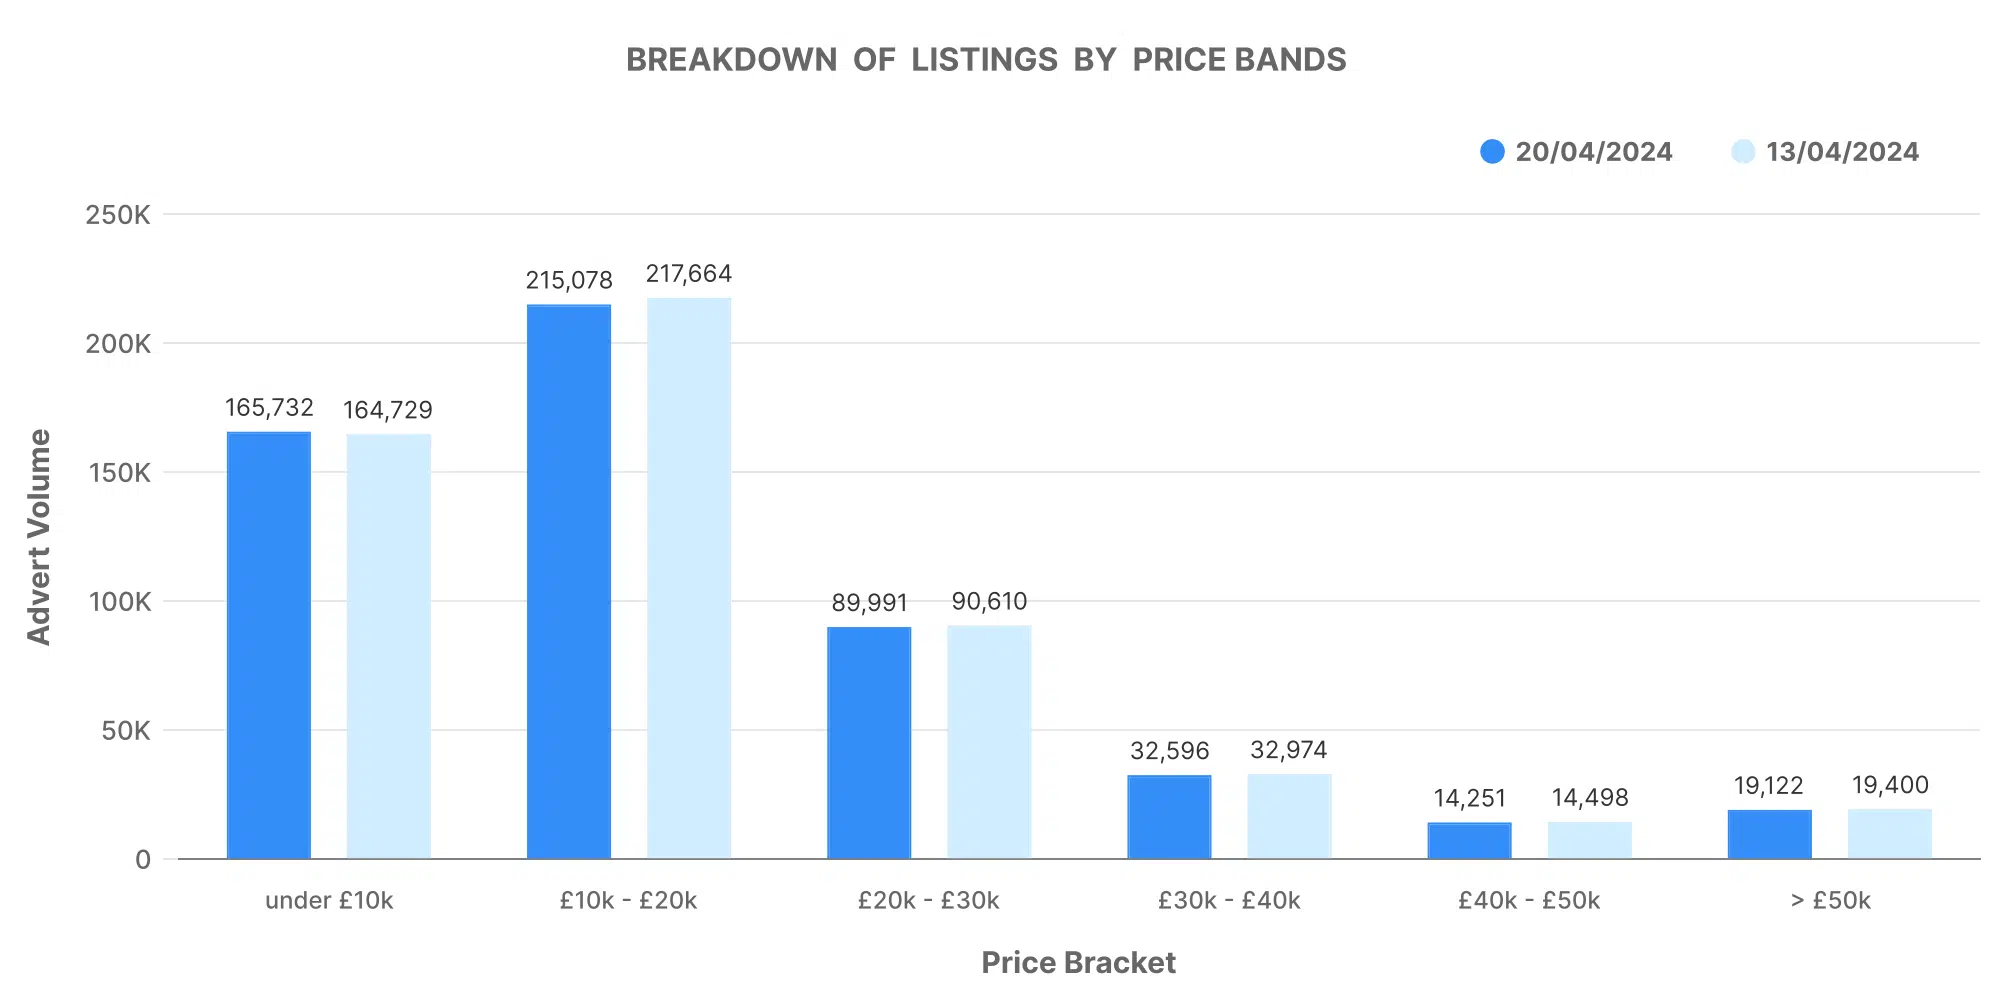
This distribution suggests a broad spectrum of buyer budgets and preferences, underscoring the importance of targeted inventory management.
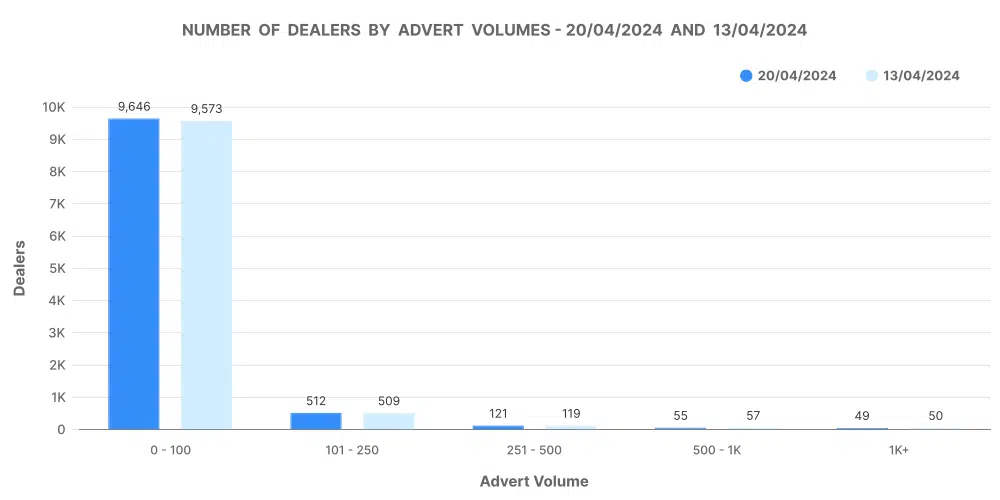
Number of Dealers by Advert Volumes
Insights show that the majority of car dealerships hold inventories in the 0-100 and 101-250 ranges, indicating a concentrated market with a significant number of small to medium-sized dealers. This segmentation is vital for understanding competitive dynamics and identifying growth opportunities in niche markets.
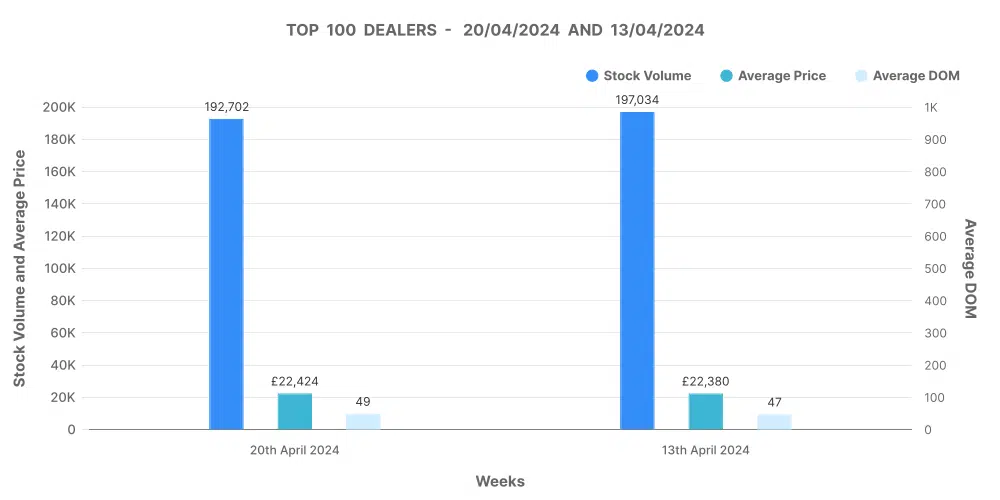
Analysis of Top 100 Dealers by Volume
The top 100 dealers have a lower average DOM (49 days) compared to those outside the top 100 (101 days), highlighting their efficiency in stock turnover. Their average price (£22,424) is also higher than the wider market, reflecting a focus on premium segments. Notably, these dealers experienced more price increases (9,690) than decreases (6,410), suggesting effective pricing strategies that capitalise on market demand.
Marketcheck UK: Enabling Strategic Decisions
Marketcheck UK equips dealers with tools to analyse these trends in real-time. Through our API and data analysis platforms, dealers can access up-to-date information on:
- Inventory levels by price band and dealer volume
- Price adjustments across different market segments
- Comparative analysis of days on market
These insights enable dealers to adjust their strategies swiftly, optimising inventory according to car market demands and enhancing profitability.