Introduction
In the vibrant arena of the UK’s automotive market, staying updated with the latest trends is essential for dealerships aiming to maximise their profits, especially in the burgeoning electric vehicle (EV) sector. This week’s analysis delves into the current state of the UK’s used electric car market, offering valuable insights and actionable data for automotive dealers.
Electric Car Market Insights
Overview of Current Market Trends
The electric car market in the UK continues to evolve, with the data from the week ending on 23rd March 2024 showing a significant interaction between various market forces. With a total of 4,280 dealers and 7,403 electric rooftops contributing to 123,557 listings, the dynamics of the market are clearly geared towards growth and expansion.
Price Trends and Market Dynamics
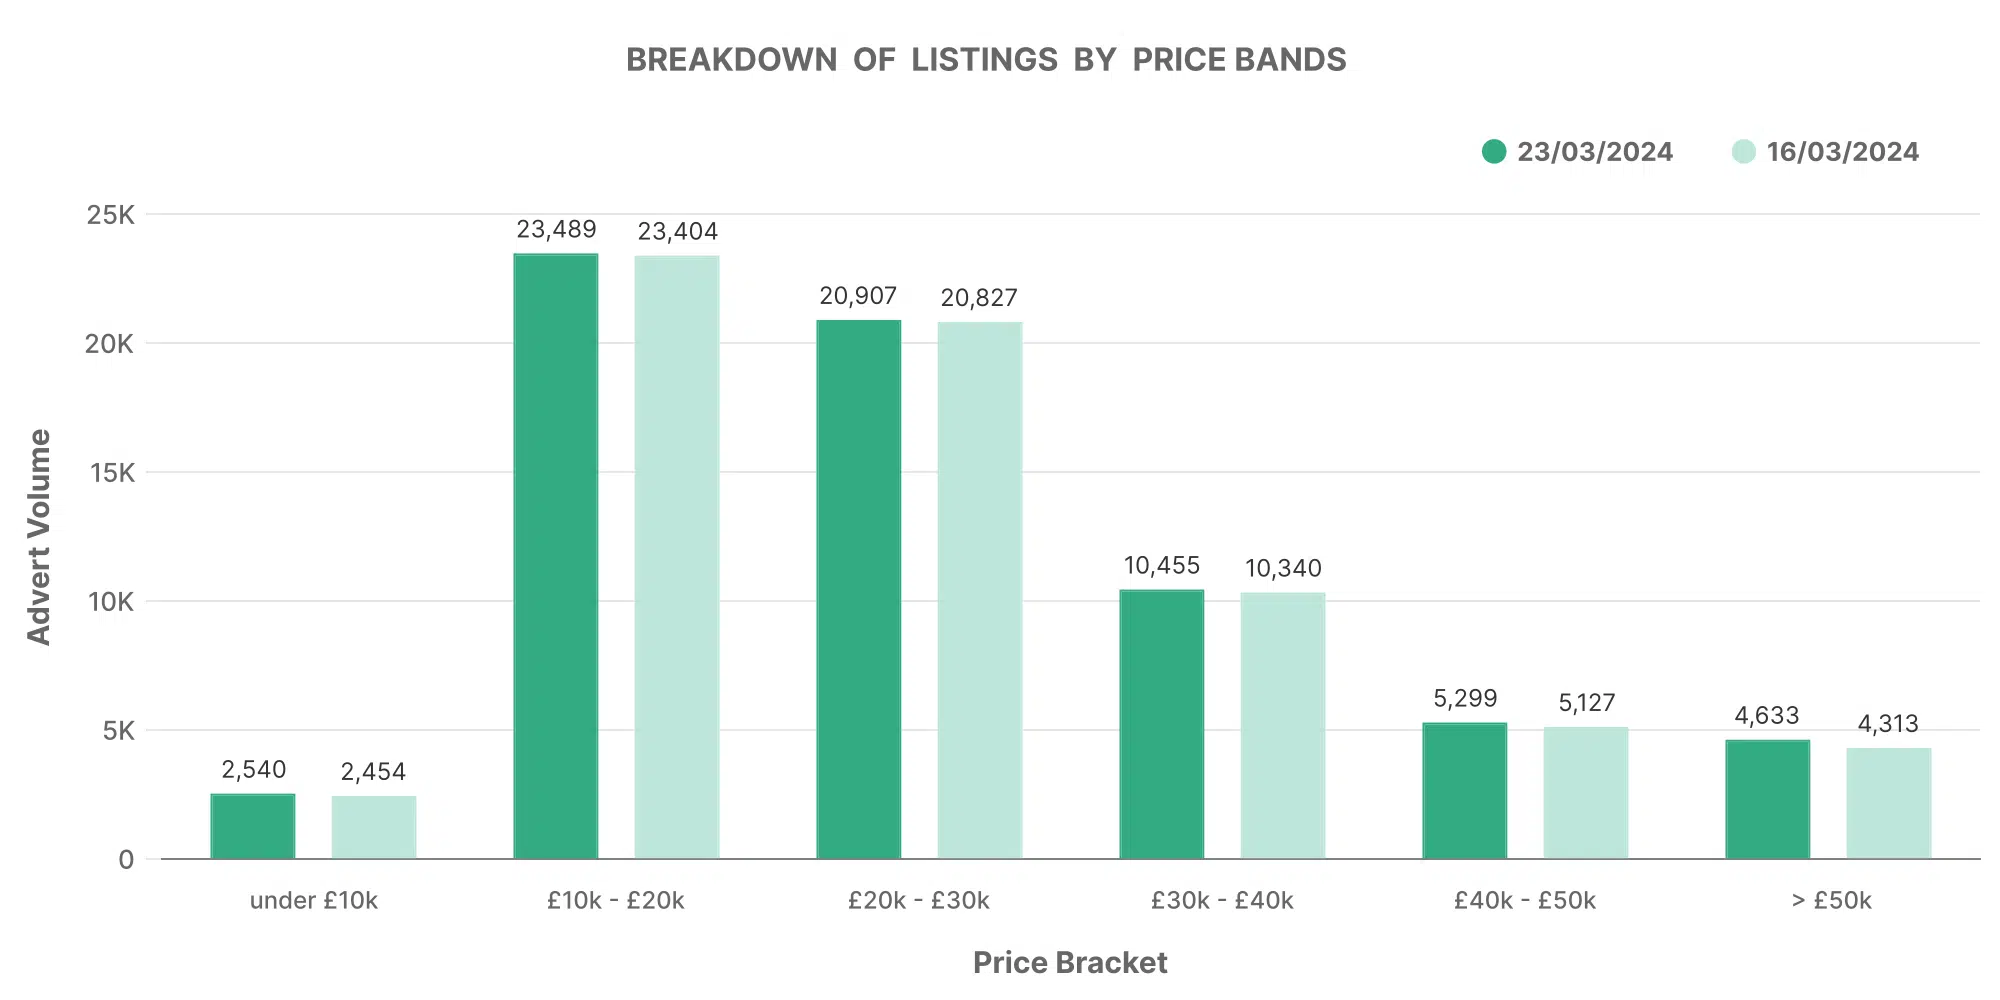
The average price for electric vehicles stands at £27,871, indicating a nuanced understanding of consumer demand and market valuation. Dealers should note the distribution across different price bands, with a considerable volume of electric cars priced between £10,000 and £30,000. This segmentation highlights consumer preferences and the competitive positioning of electric vehicles within the market.
Analysing Dealer Performance
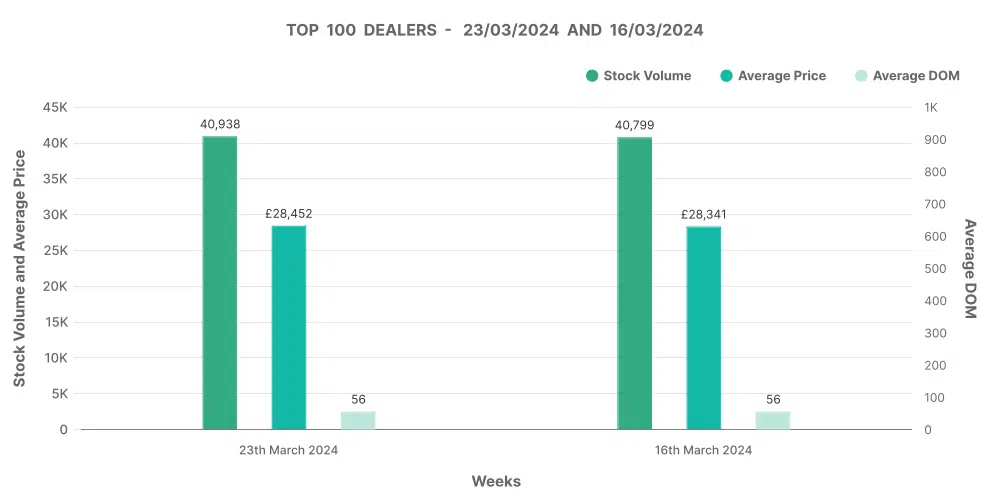
The performance metrics for dealers are particularly telling. The top 100 dealers hold a substantial stock volume, yet their average days on market (DOM) stands at 56, suggesting a brisk turnover and healthy demand. This contrasts with the broader market, where the average DOM is 70. Understanding these nuances can guide dealers in pricing and inventory management.
Marketcheck UK’s Relevance
Marketcheck UK empowers dealers with comprehensive data, like the kind showcased in this report, enabling them to make informed decisions. By leveraging Marketcheck’s tools and data feeds, dealers can gain a competitive edge, understanding nuances in pricing, inventory management, and market trends.
Graph Analysis
Breakdown of Listings by Price Bands
The distribution of electric cars across various price bands offers a clear view of market segmentation. Dealers can align their inventory to meet the most popular price points, potentially increasing turnover rates and customer engagement.
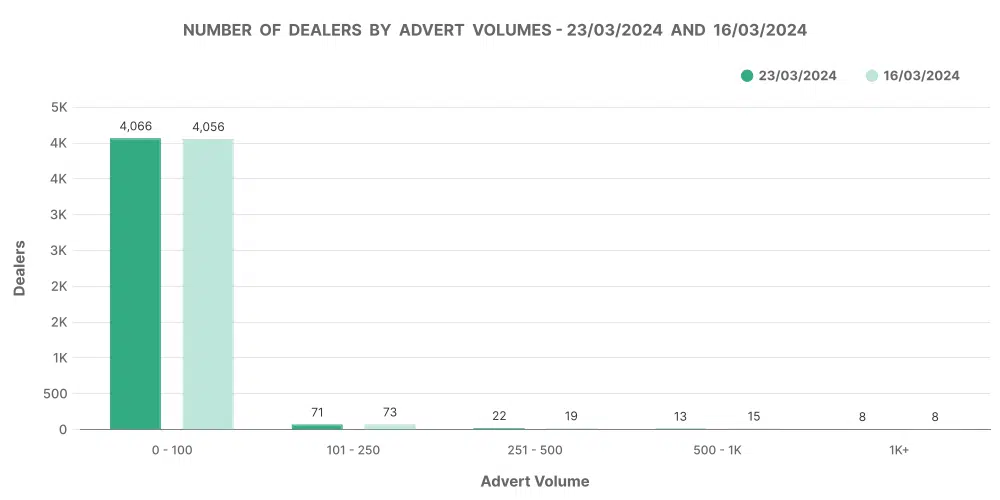
Number of Dealers by Advert Volumes
Understanding the distribution of advert volumes across dealers can spotlight market competition and reveal opportunities for dealers to optimise their advertising strategies.
Analysis of Top 100 Dealers by Volume
The performance of the top 100 dealers offers benchmarks for success in the electric vehicle market. By analysing these dealers’ strategies, others can adapt and refine their approaches to inventory and pricing.
Conclusion
The data presented underscores the dynamic nature of the UK’s used electric car market. For automotive dealers, leveraging this information can lead to more strategic decision-making, aligning their offerings with market demands and staying ahead in the competitive landscape.